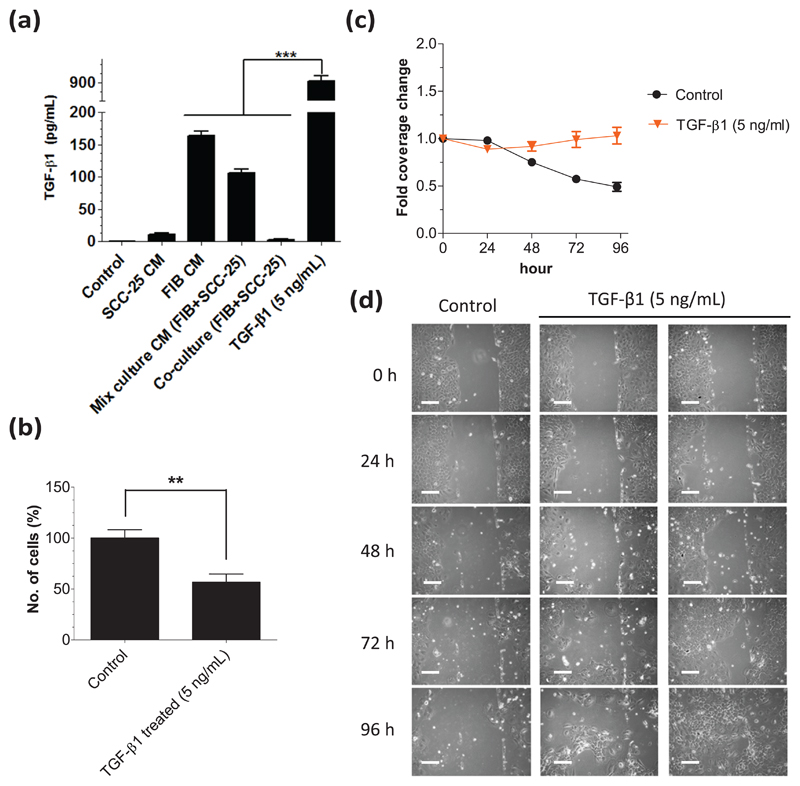
Figure 2.
FIB and SCC-25 cells produce TGF-β1 and the effects of TGF-β1 on SCC-25 cell proliferation and migration. (a) The TGF-β1 concentrations in the supernatants were measured using ELISA after 3 days of treatment. SCC-25 cells treated with 5 ng/mL TGF-β1 contained 917.1 ± 38.12 pg/mL in the supernatant. In the supernatant of the albumin-medium-treated (control) SCC-25 cells, there was almost no detectable TGF-β1 (0.3 ± 0.12 pg/mL). Significant levels of TGF-β1 were measured in the supernatants of FIB CM (164.1 ± 6.85 pg/mL) and mixed-culture CM (106.0 ± 5.82 pg/mL)-treated SCC-25 cells, whereas the TGF-β1 levels in co-culture (2.3 ± 0.94 pg/mL) were low. In the supernatant of SCC-25-CM-treated cells 10.4 ± 2.53 pg/mL TGF-β1 was measured. (b) After treatment with 5 ng/mL TGF-β1, there were significantly (p < 0.01) less SCC-25 cells growing than in the albumin-medium treated (control). (c) 0–96 h treatment with 5 ng/mL TGF-β1 leads to no change in coverage of the scraped area, while in the albumin-medium treated (control; p < 0.001), it was decreased. (d) 48–96 h treatment with 5 ng/mL TGF-β1 cells were also distributed over the scraped area (CM: conditioned medium; FIB: human gingival fibroblasts; **p < 0.01; ***p < 0.001). Cells treated with 5 ng/mL TGF-β1 showed elongated, mesenchymal-like morphology at 72–96 h (bars: 100 μm).

