
Figure 1. Schematic of Elevation off-target predictive modelling.
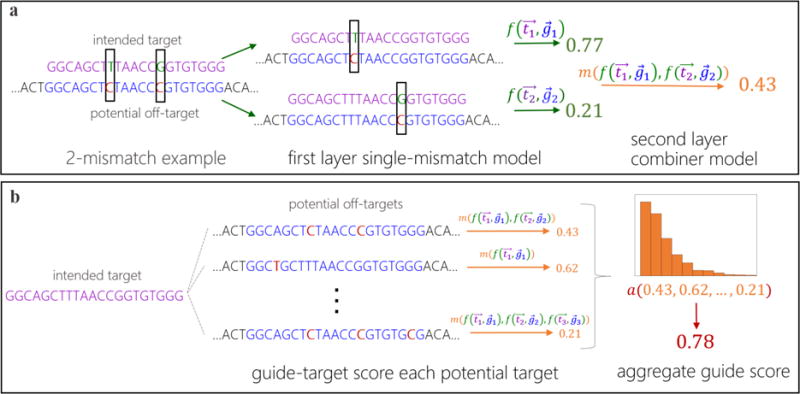
(a) An example of how to score a gRNA-target pair with two mismatches. First the gRNA-target pair is broken down into two single-mismatch pseudo-pairs, each of which is scored with the first layer (single mismatch) model, . Then these scores are combined with the second-layer model, , yielding a single gRNA-target score that accounts for all mismatches. (b) An example of how to aggregate the set of gRNA-target scores for a single gRNA into one summary off-target score for a gRNA. The aggregator model, a(), computes statistics of the input distribution of gRNA-target scores as features and runs them through a model, producing the aggregate score for a gRNA (e.g. 0.78).