
Figure 5. Joint scoring and aggregation on viability screens.
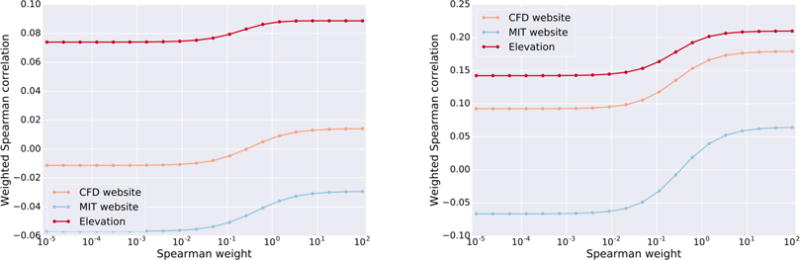
Weighted spearman correlation of Elevation to the crispr.mit.edu server. (a) Avana data (N=4,950) was used to train and Gecko to test (N=4,697), (b) the reverse of a. Note that the MIT website often yields correlation in the wrong direction. The final Elevation model deployed in our cloud service uses the model trained on Avana.