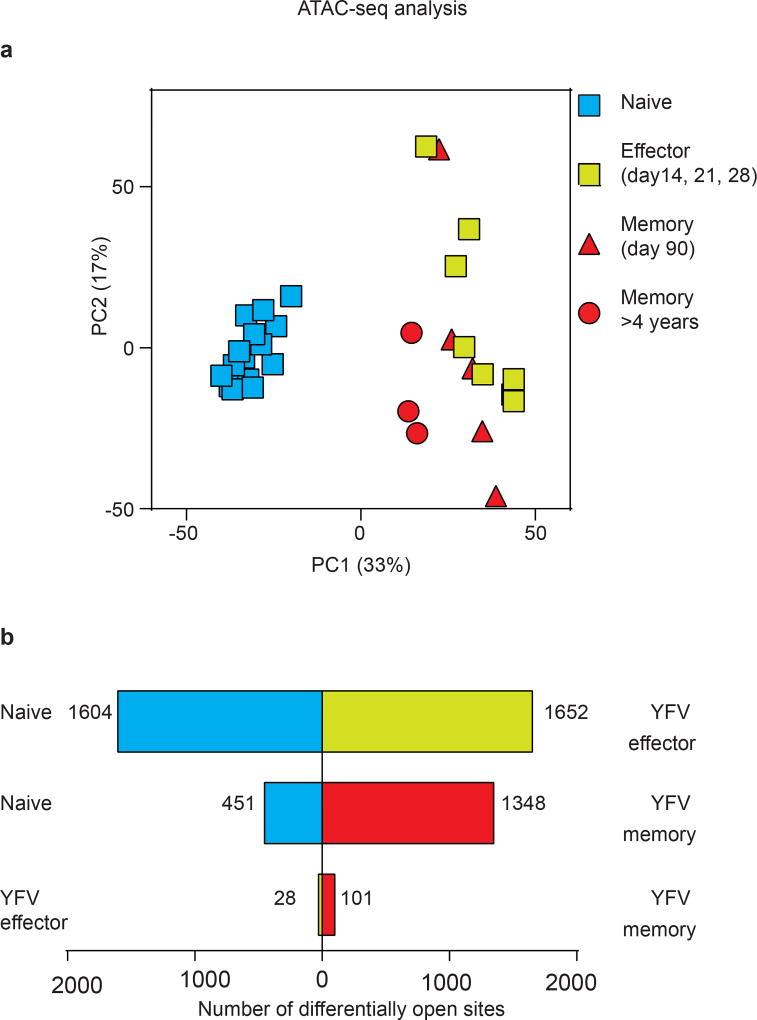
Extended Data Figure 8. Analysis of open chromatin sites in YFV-specific effector and memory CD8 T cells using ATAC–seq.
ATAC–seq analysis was performed using naive CD8 T cells (n = 15) and YFV-tetramer+ effector (n = 8), early memory (n = 5) and long-lived memory CD8 T cells (n = 3). a, Principal component analysis of ATAC–seq data showing principal component 1 (PC1) versus 2 (PC2). Each circle represents a sample from one donor. b, Comparison of the number of open chromatin peaks that are significantly different between CD8 T cell subsets. Bars to the left, number of open sites in the subset listed to the left; bars to the right, number of open sites in the CD8 T cell subset that was used for comparison. The day 90 YFV-memory (n = 5) and >4 year YFV-memory (n = 3) samples were all placed in the memory group for this comparison.

