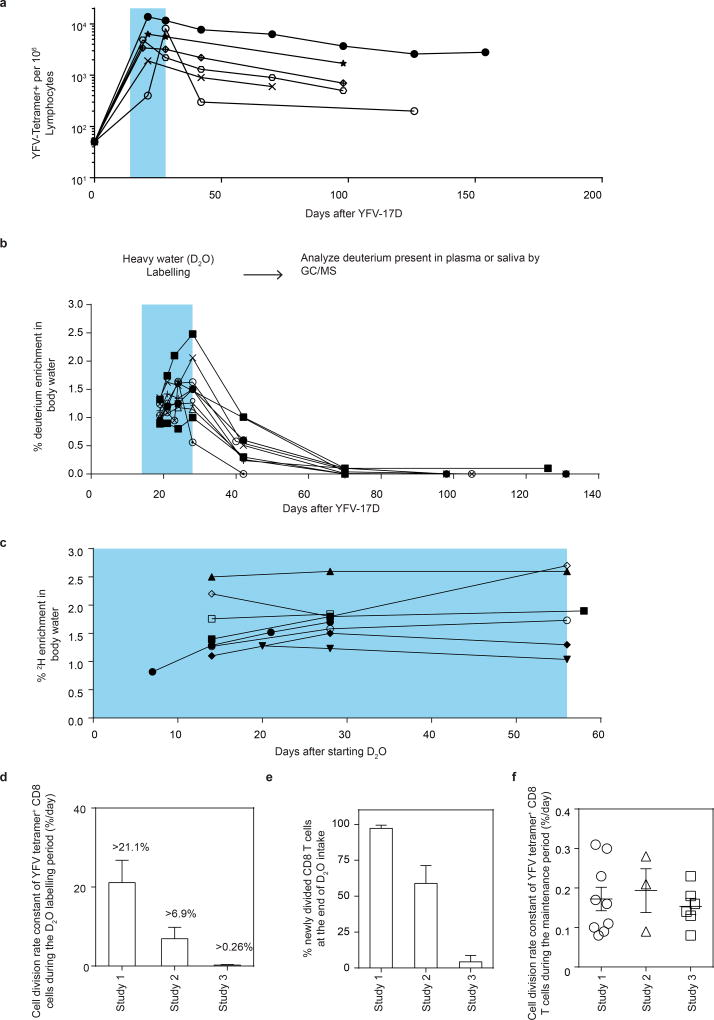
Extended Data Figure 2. Investigating the in vivo kinetics of YFV-specific CD8 T cells using heavy water labelling at a range of stages of the immune response to YFV-17D.
a, Kinetics of the CD8 T cell response tracked by MHC class-I tetramer staining for vaccinees in study 2. b, c, Graphs show dynamics of the deuterium enrichment in body water for each vaccinee in study 2 (b, n = 8) and study 3 (c, n = 8). The period of water intake is indicated by the shaded blue area. d. The cell division rate constant (mean and s.d.) of A2-NS4B214 tetramer+ CD8 T cells. This represents the rate per day of newly divided A2-NS4B214 tetramer+ CD8 T cells during the D2O labelling period. Deuterium incorporation at the end of the water intake period in each study was used for this calculation. e. The percentage of deuterium-labelled A2-NS4B214 tetramer+ CD8 T cells (mean and s.d.) at the end of the water intake period in each study. f, The cell division rate constants of YFV-specific memory CD8 T cells during the maintenance period (same data as in Fig. 2f). Each circle represents data from one donor; horizontal lines show mean and s.e.m. The division rate constants were calculated by dilution kinetics of deuterium enrichment (studies 1 and 2) or by incorporation kinetics of deuterium uptake (study 3).

