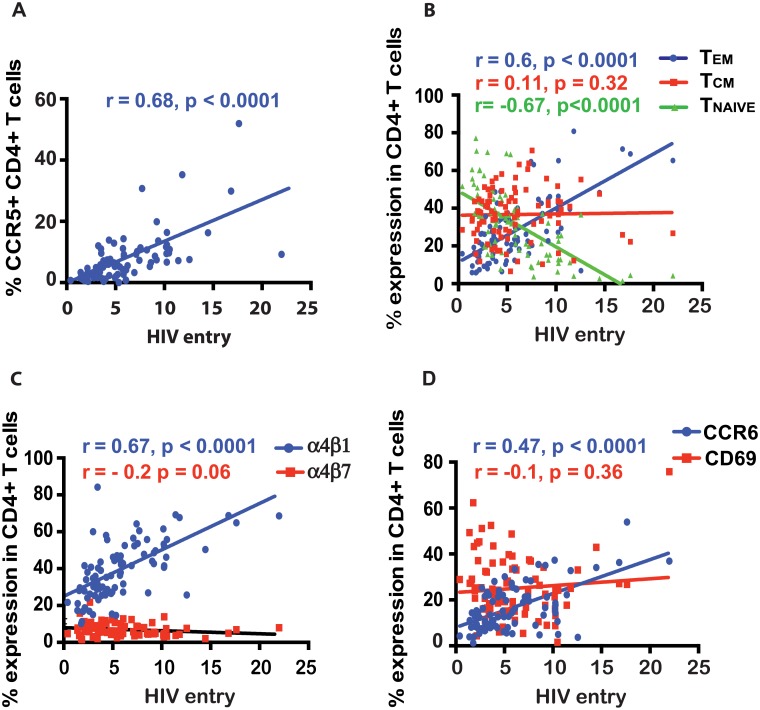
Fig 3. Correlation between bulk HIV entry into CD4+ T cells and the frequency of various blood CD4+ T cell subsets within an individual.
Various blood CD4+ T cells are indicated in the figure legend (A-D). *, **, and *** indicate p values <0.01, <0.001 and <0.0001 respectively. TCM and TEM refer to central and effector memory CD4+ T cells respectively.

