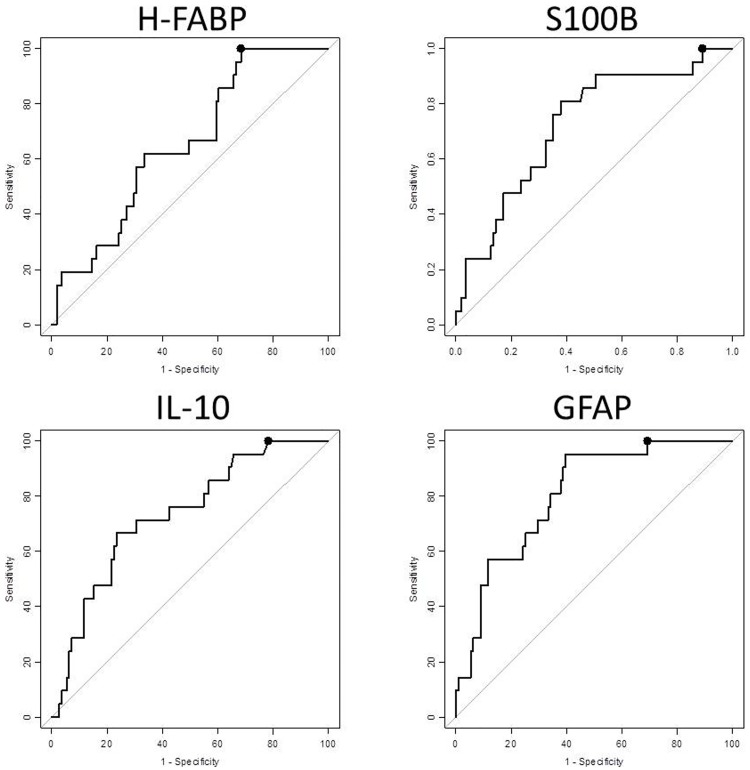
Fig 1. The proteins performances at classifying mTBI CT-positive and CT-negative patients.
Performance was investigated at 100% sensitivity, and the specificity (dots) reached 31.5% for H-FABP (95% CI 23.4–39.6; cut-off: 1.99 ng/mL), 10.8% for S100B (95% CI 5.4–17.1; cut-off: 0.06 ug/L), 21.6% for IL-10 (95% CI 14.4–28.8; cut-off: 0.12 pg/mL) and 30.6% for GFAP (95% CI 22.5–39.6; cut-off: 97.31 pg/mL).

