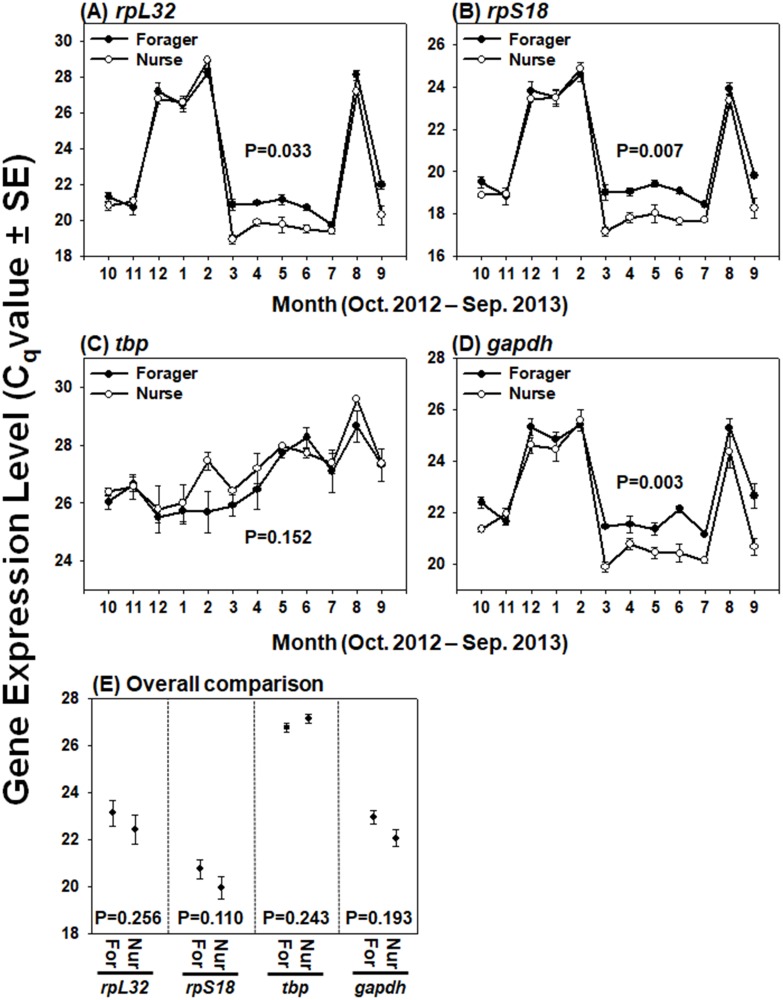
Fig 1. Expression patterns of four candidate reference genes in head samples of foragers and nurses.
Seasonal expression patterns, indicated by quantification cycle (Cq) values of four candidate reference genes over a yearlong cycle, are represented for the foragers and nurses by the closed black circle and open white circle, respectively (A-D). Cq values of each gene over the year in foragers and nurses were statistically analyzed with repeated-measures ANOVA (A-D). Average and standard error of Cq values of each gene for forager head (For) and nurse head (Nur) were calculated from the data of three colonies for 12 months (E). Integrated expression level of each gene between foragers and nurses were statistically analyzed with Student’s t-test (E).

