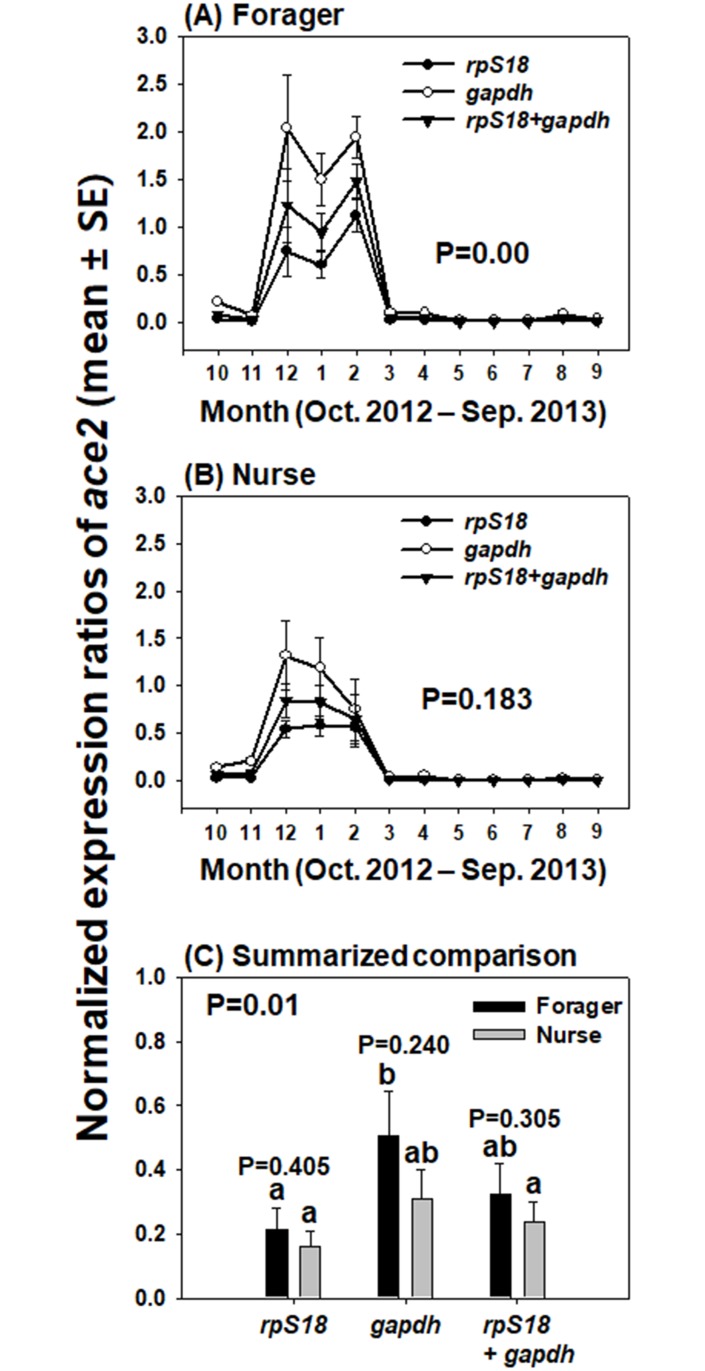
Fig 2. Expression patterns of ace2 normalized with each of the two reference genes and combination of two genes in forager and nurse heads.
The transcript trends of ace2 in the head samples of foragers (A) and nurses (B) were determined by qRT-PCR using gapdh, rpS18, and normalization with two reference genes. The expression trends of ace2 over a yearlong cycle, calculated on a monthly basis across different reference genes, were statistically analyzed (repeated-measures ANOVA; Post-hoc: Tukey’s multiple comparison test, P < 0.05) (A and B). Average and standard error of the expression levels of ace2, normalized with a single gene (rpS18 or gapdh) and the combination (two genes), were calculated from the data of three colonies for 12 months (C). P values between forager and nurse sample were analyzed with Student’s t-test, while integrated expression levels of ace2 for foragers and nurses analyzed with different reference genes (total 6 sample comparison) were compared with one-way ANOVA with Tukey’s multiple comparison test. Different letters indicate significantly different values (P = 0.01).

