. 2018 Jun 1;30(6):876–884. doi: 10.1162/jocn_a_01252

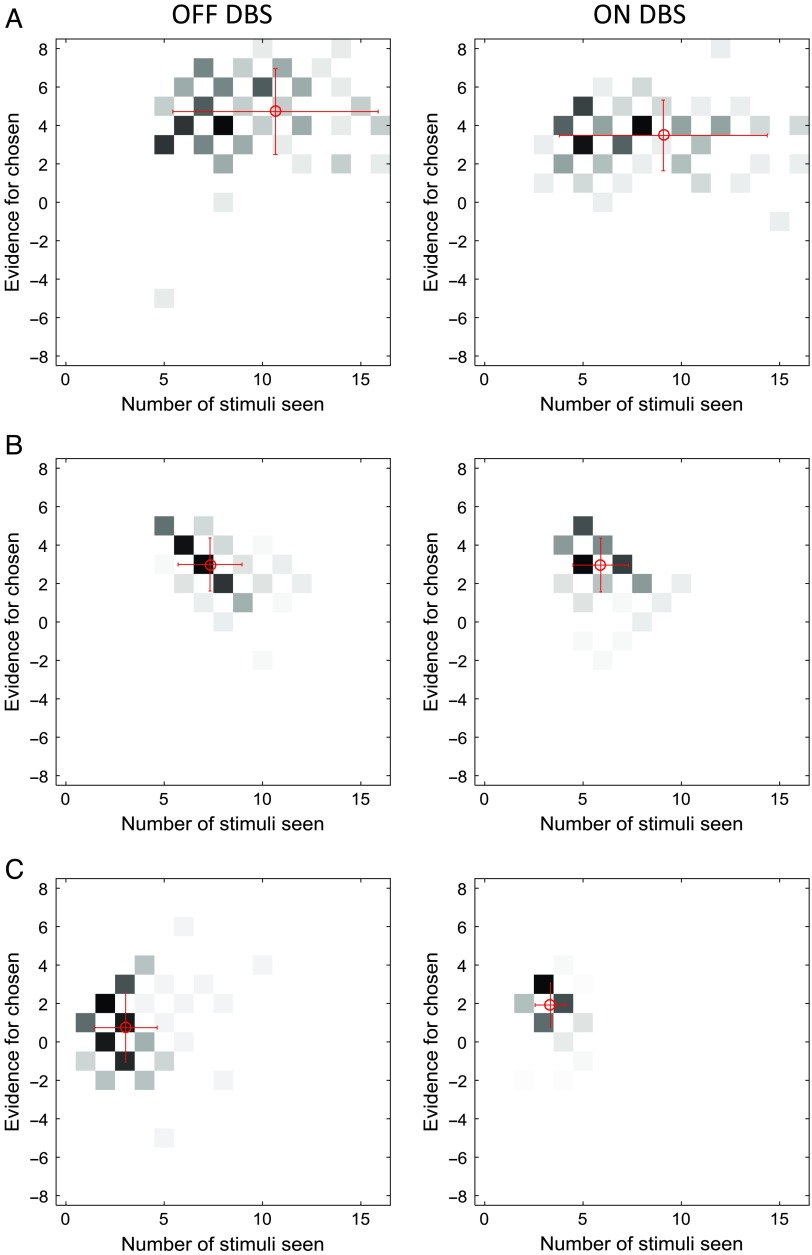
Figure 3. . Examples of distributions of combinations of time and evidence at which choices were made. Different panels correspond to different patients. Data in A come from the fast rate condition, whereas data in B and C come from the slow rate condition. Displays in the left column show data from an STN DBS off condition, whereas displays in the right column correspond to STN DBS on condition. In each display, the darkness of a square indicates the number of trials at which the choice was made after seeing a particular number of stimuli (x axis) and particular accumulated evidence (y axis). The color scale is normalized such that black corresponds to the maximum of a histogram. The coordinates of red circles indicate the mean number of stimuli and evidence, whereas the whiskers indicate standard deviations.

Figure 3.