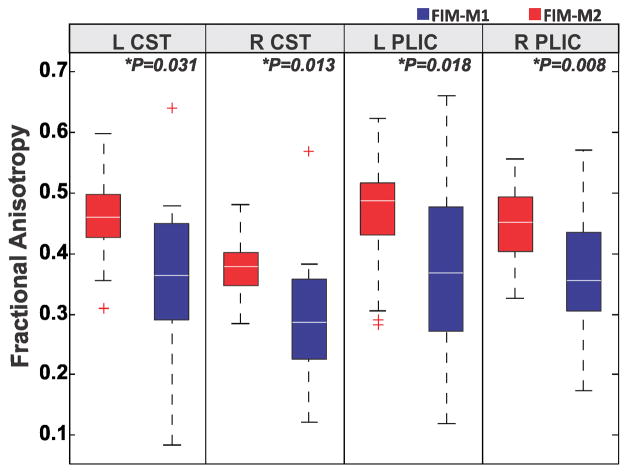
Figure 2.
Box plot graphic representation of Z-score fractional anisotropy (FA) values showing the median values (horizontal line inside the box), quartiles (box boundaries), and the largest and smallest FA values. *significant difference between the clusters (A–C; B–C) (P<0.05). ** significant difference between the clusters (A–B) (P<0.05)
L-CST: Left corticospinal tract; R-CST: Right cortico spinal tract; L-PLIC: left posterior limb of the internal capsule; R-PLIC: Right posterior limb of the internal capsule; L-peduncle: Left peduncle; R-peduncle: Right peduncle.

