Figure 3.
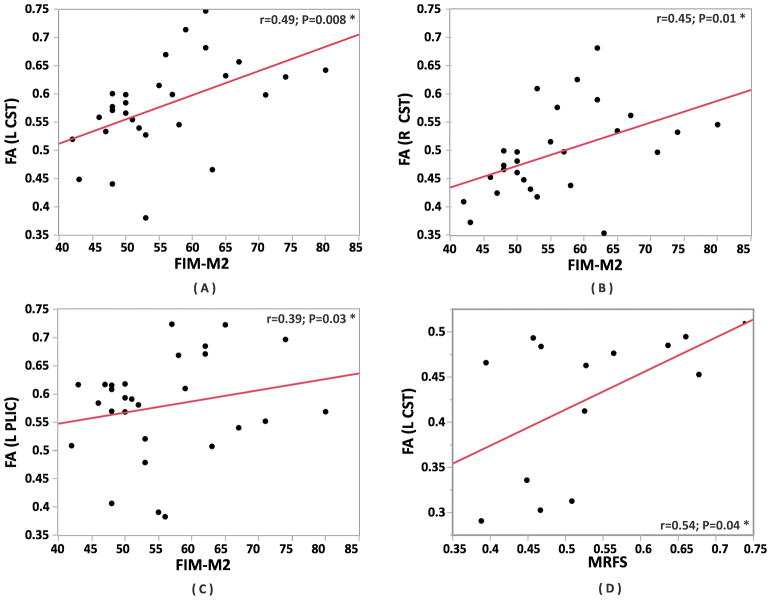
Spearman rho correlation coefficient analyses within the clusters. The left panel showing the correlations. The correlations are sorted by the most significant on top. The right panel shows scatter plots between FA within the right peduncle and ΔFIM (A), FA within left CST and MRFS (B), FA within right CST and ΔFIM (C), FA within right CST and MRFS (D), FA within right PLIC and ΔFIM (E) and FA within right PLIC and MRFS (F). The subjects within each cluster are represented by (green=cluster A; red=cluster B; blue=cluster C).
*significant difference between the groups P<0.05 (corrected). ** significant difference between the groups P<0.004 (uncorrected).
L-CST = Left corticospinal tract; R-CST = Right corticospinal tract; L-PLIC = Left posterior limb of the internal capsule; R-PLIC = Right posterior limb of the internal capsule; ΔFIM = gain of FIM motor sub-score; FA = Fractional Anisotropy; MRFS = Montebello Rehabilitation Factor Score.

