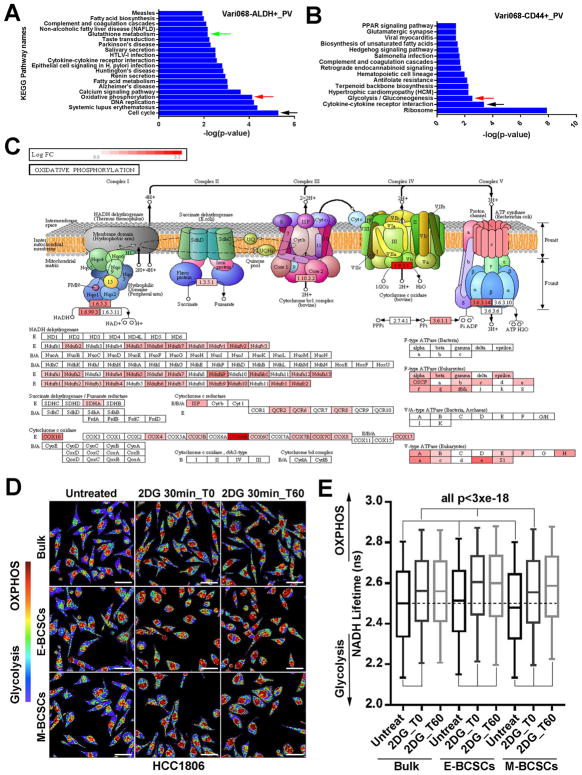
Figure 2. E- and M-BCSCs Exhibit Distinct Metabolic Pathways and Enhanced Metabolic Plasticity.
(A–C) Pathways enriched in E- (A) and M- (B) BCSCs and ETC complex genes elevated in E-BCSCs (C) of Vari068.
(D, E) E- (ALDH+) and M- (ALDH−CD24−CD44+) BCSCs and bulk cells (ALDH−CD24+CD44−) from HCC1806 were plated, treated with or without 2DG and measured by FLIM immediately or after 1h culture (D) and NADH Lifetimes calculated from 400–500K cells in each condition (E). Bar: 40 μm, all p<3×10⁻¹⁸.

