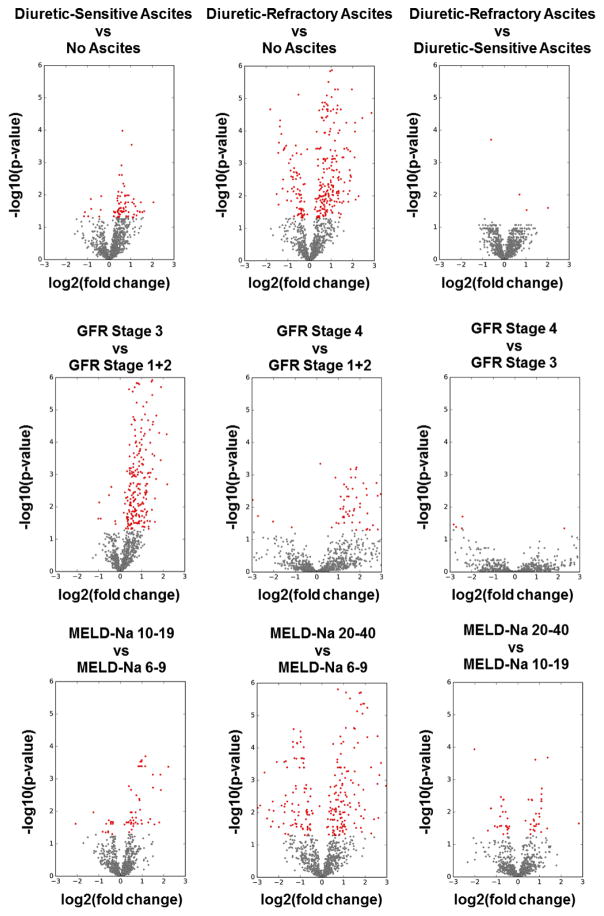
Figure 6.
Volcano plots for the statistical analysis of metabolites vs clinical variables. Shown in the figure are the scatterplots of P value as a function of fold change for severity of ascites, GFR stages, and MELD-Na score classes. Overall, the plots show robust separation of metabolite values with clinical variables. Red color: significant metabolites. Gray color: detected metabolites, not significant.

