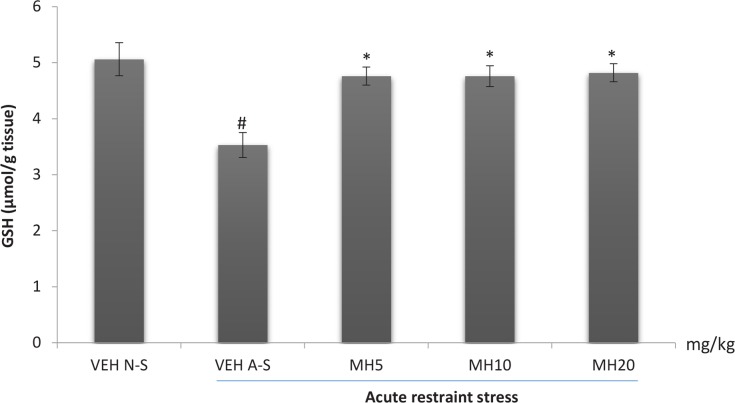
Figure 6.
Effect of Morin hydrate on GSH levels in mice brain exposed to acute restraint stress
Each bar is expressed as Mean±S.E.M; # P<0.01 When compared with the control; * P<0.05 When compared with the untreated group (one-way ANOVA followed by Tukey post-hoc test); VEH N-S: Vehicle Non-Stress; VEH A-S: Vehicle Acute Stress; MH: Morin Hydrate

