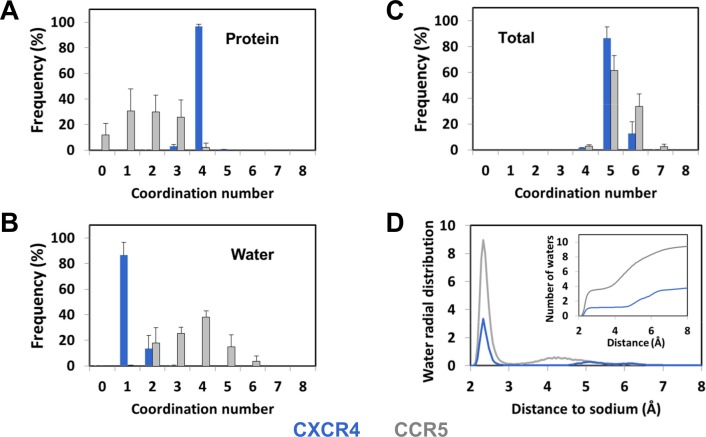
Fig 6. Coordination of the sodium ion bound to CXCR4 and CCR5 during MD simulations.
(A) Distribution of the number of interactions between the sodium ion and coordinating atoms from the protein (carbonyl, carboxyl and hydroxyl groups, NE2 from His). (B) Distribution of the number of interactions between the sodium ion and water molecules. (C) Distribution of the total coordination number of the sodium ion. In (A-C), the threshold for interaction was 3Å. (D) Radial distribution of the water molecules around the sodium ion during the MD simulations. The insert represents the integrated radial distribution and gives the number of water molecules as a function of the distance to the sodium ion. Data represent the average of the replicates (± standard deviations in A-C). Data for CXCR4 and CCR5 are shown in blue and grey, respectively.

