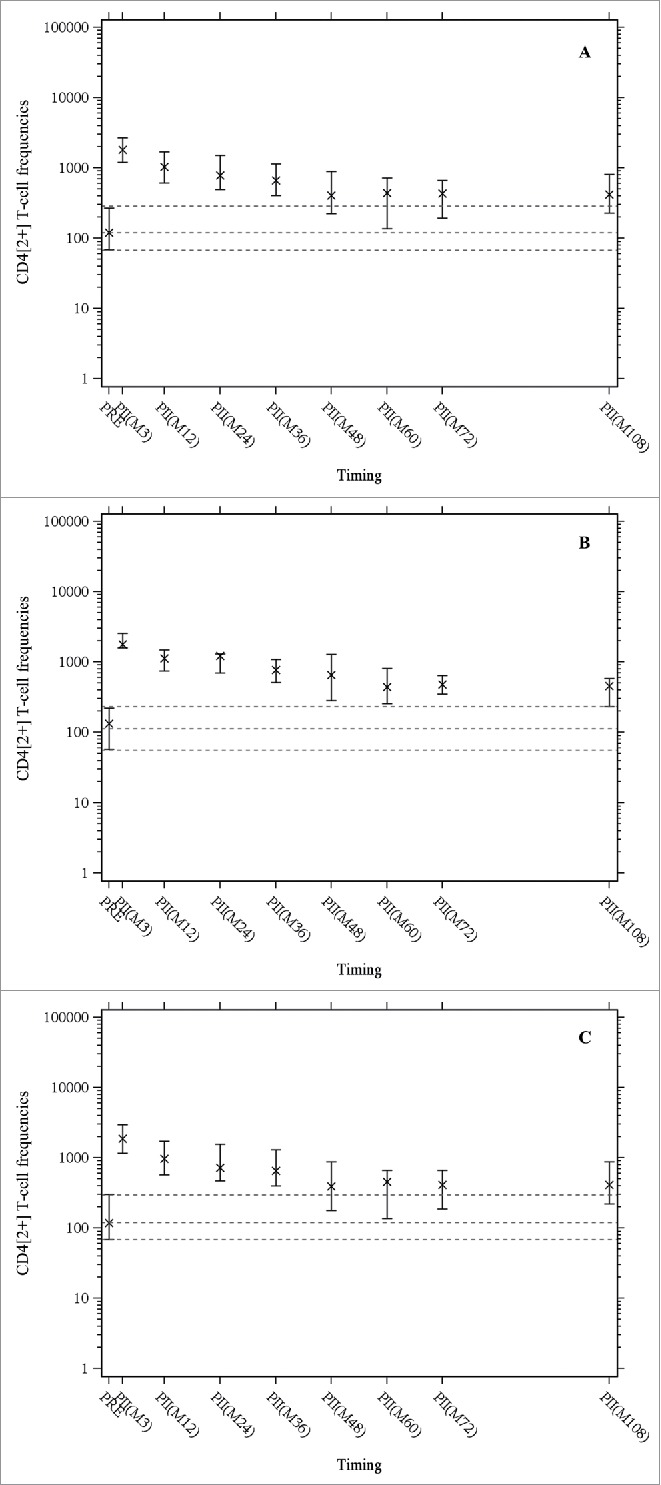
Figure 1.

The median frequencies of CD4+ T cells expressing at least two activation markers (among CD40 ligand, interleukin-2, tumor necrosis factor-α, and interferon-γ) per 106 cells after in-vitro stimulation with gE were measured by intracellular cytokine staining followed by flow cytometry. X indicates medians, the horizontal bars indicate Q1 and Q3, dashed lines indicate pre-vaccination values (Q1, median, Q3); PRE = before vaccination; PII(Mxx): xx months after the first dose of vaccination. Panel A: Overall population; Panel B: age cohort 60 – 69 years; Panel C: age cohort ≥ 70 years.
