
Figure 4.
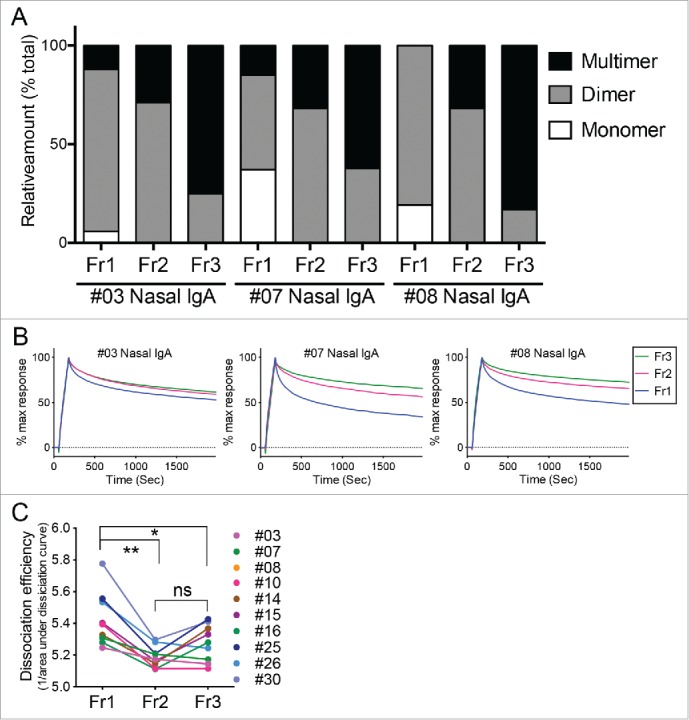
Binding dynamics of human nasal IgA samples to HA. (A) Relative proportions of IgA monomers, dimers, and multimers in the Fr1, Fr2, and Fr3 fractions from three representative individuals (#03, #07, and #08). These calculations were performed on the basis of density quantification of the bands on blue native-PAGE gels (see Fig. 2D). (B) These Fr1, Fr2, and Fr3 IgA samples were subjected to surface plasmon resonance analysis of their binding dynamics to the recombinant trimeric hemagglutinin from A/Victoria/361/2011 (H3N2). Sensorgrams were y-axis adjusted (0 = baseline, 100 = binding) to allow comparisons between samples in terms of the dissociation rate of IgA from HA. (C) Fr1, Fr2 and Fr3 IgA samples derived from 10 volunteers were subjected to SPR analysis. Dissociation efficiency of Fr2 and Fr3, which were defined as the reciprocal of area under the dissociation curve (AUC) of SPR response, were significantly lower than that of Fr1. The data are expressed as scatter plots with mean ± SD. *p < 0.05, **p < 0.01, as determined by paired t-test. ns, not significant.