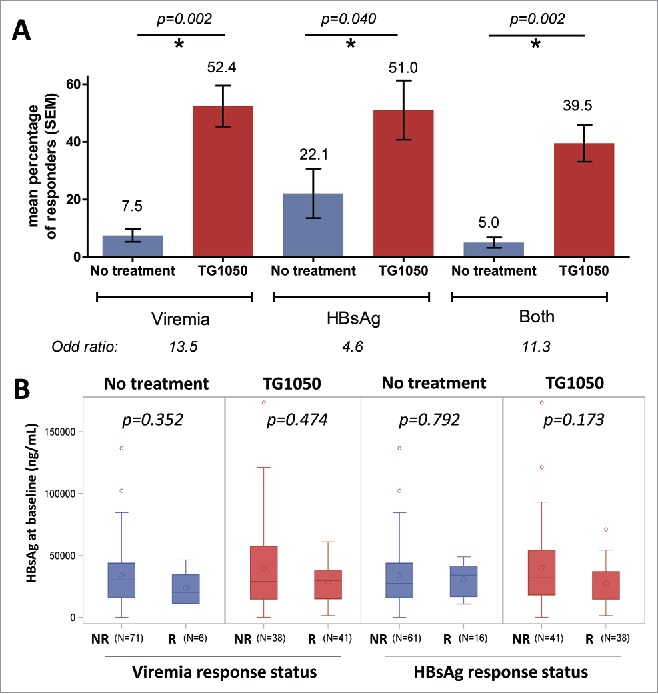
Figure 1.

Responder mice were defined as a mouse displaying a decrease in HBV-DNA (viremia), circulating HBsAg levels or both together higher than 0.5 log from baseline value for two or more time points during the study. (A) Overall response rate in seven experiments (mean percentage from 7 individual experiments). P-values for responders in TG1050 treated (red) and not-treated (blue) mice are shown above the graph. The increase in the chance (odd-ratio) to present a response (decrease in viremia, HBsAg or both) when treated with TG1050 is shown below the graph. (B) Circulating HBsAg levels before treatment in non-responder (NR) and responder mice (R), for viremia (left) or HBsAg (right). Values of individual mice from all 7 seven experiments are analyzed together. N is the number of mice analyzed in each bar. The median is indicated by a horizontal line, the mean by a big circle. P-values for responders versus non-responders are shown above the plots.
