Figure 3.

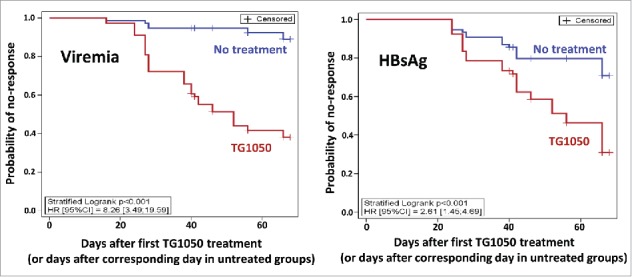
Time-To-Response with a stratified Log-rank test. The probability of no-response is shown for viremia (left) and HBsAg (right), for untreated mice (blue) or TG1050 treated mice (red).

Time-To-Response with a stratified Log-rank test. The probability of no-response is shown for viremia (left) and HBsAg (right), for untreated mice (blue) or TG1050 treated mice (red).