. 2018 Jul 3;7:e35458. doi: 10.7554/eLife.35458

Figure 2. A panel of kinase activity and activation biosensors.

(a) Domain structure of FLARE-EKAR-EV (above). Time-course of mean fluorescence anisotropy of Venus-cp172Venus FLARE-EKAR-EV WT (blue, N = 13) and kinase-insensitive mutant (red, N = 16) expressed in HEK293T cell, with addition of 100 ng/mL EGF at t = 0 min and 20 μM U0126 at t = 25 min (left). Summary of anisotropy changes (upper right, two-tailed t-test, p<0.0001), calculated as the difference between the mean anisotropy from t = 10 min to t = 15 min and the mean anisotropy of the baseline before drug addition. The mean is shown, with the error reflecting the standard error of the mean. Representative anisotropy pseudocolor image before EGF stimulation (t = 0 min), after EGF stimulation (t = 25 min), and after inhibition of MEK with U0126 (t = 47.5 min) (lower right). (b) Domain structure of FLARE-CKAR (above). Time-course of fluorescence anisotropy of Venus-cp172Venus FLARE-CKAR WT (blue, N = 26) and kinase-insensitive mutant (red, N = 119) with addition of 100 ng/mL phorbol 12-myristate 13-acetate (PMA) at t = 0 min. Summary of response magnitudes (upper right, two-tailed t-test, p<0.0001), calculated as the difference between the mean anisotropy from t = 10 to t = 11.33 min and the mean anisotropy of the baseline before drug addition. The mean is shown, with the error reflecting the standard error of the mean. Representative anisotropy pseudocolor image before PMA addition (t = 0 min) and after PMA addition (t = 15 min). (c) Domain structure of FLARE-MLCK (top). Anisotropy time course of a representative REF52 cell expressing YFP-Venus FLARE-MLCK treated with 30 mM KCl at t = 0 (N = 13, blue), or vehicle control (N = 10). Summary of anisotropy changes, calculated as the mean difference between the anisotropy at t = 0.333 min and the anisotropy of the baseline, before KCl addition (upper right, two-tailed t-test, p<0.0001). Representative pseudocolor anisotropy images before and after KCl treatment (lower right). Dashed lines above and below time course traces reflect the standard error of the mean. FP, fluorescent protein; CaM BD, MLCK calmodulin-binding domain.
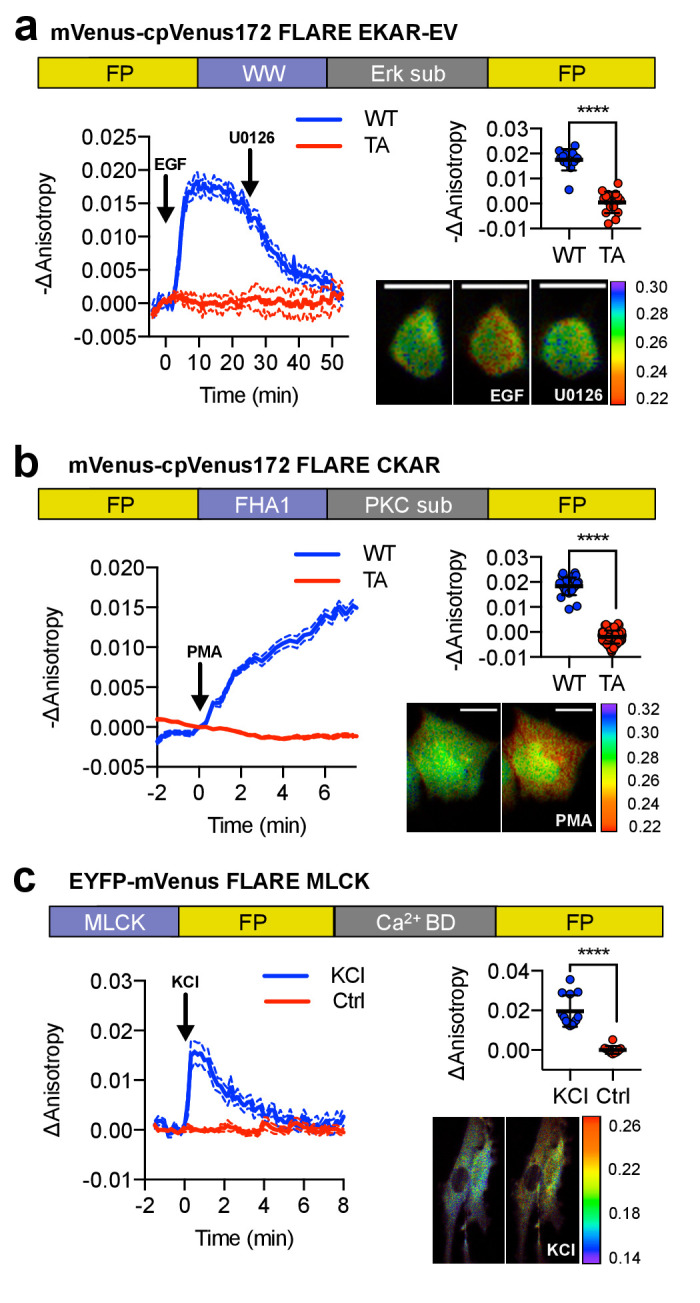
Figure 2—source data 1. FLARE kinase biosensor panel.
(a) Sheet 1, Figure 2a. Time course for Venus-cp172Venus FLARE EKAR, both wild type and kinase-inactive (TA) mutant. (b) Sheet 2, Figure 2a. Comparison of magnitudes of anisotropy changes for Venus-cp172Venus FLARE EKAR, both wild type and kinase-inactive (TA) mutant, of upon EGF addition, and relevant statistical tests to compare the two variants. (c) Sheet 3, Figure 2—figure supplement 1c. Changes of magnitudes of anisotropy change for various FLARE EKAR variants upon EGF addition. (d) Sheet 4, Figure 2b. Time course for Venus-cp172Venus FLARE CKAR, both wild type and kinase-inactive (TA) mutant. (e) Sheet 5, Figure 2b. Comparison of magnitudes of anisotropy changes for Venus-cp172Venus FLARE EKAR, both wild type and kinase-inactive (TA) mutant, of upon EGF addition, and relevant statistical tests to compare the two variants. (f) Sheet 6, Figure 2—figure supplement 2. Time courses for CKAR1 and CKAR2. (g) Sheet 7, Figure 2—figure supplement 3c. Changes of magnitudes of anisotropy change for various FLARE CKAR variants upon PMA addition. (h) Sheet 8, Figure 2c. Time course for FLARE MLCK, with either addition of KCl and vehicle only control. (i) Sheet 9, Figure 2c. Summary for magnitude of responses for FLARE MLCK.

Figure 2.

Figure 2—figure supplement 1. FLARE-EKAR characterization.

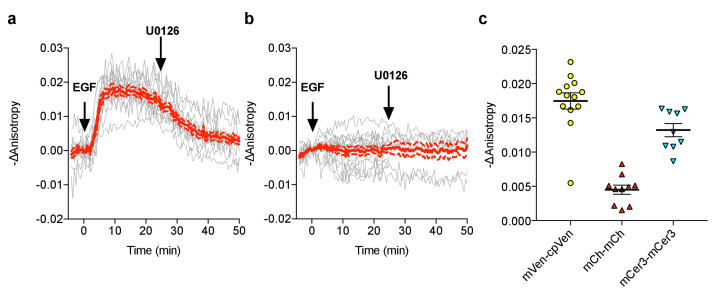
Figure 2—figure supplement 1.

(a) Individual (gray) and average (red) cell traces for Venus-cp172Venus FLARE EKAR (N = 13), expressed in HEK293T cells and treated with 100 ng/mL epidermal growth factor (EGF) at t = 0 min and the MEK inhibitor U0126 at t = 25 min. (b) Individual (gray) and average (red) cell traces for Venus-cp172Venus FLARE EKAR with a threonine-to-alanine (T–to–A) at the phosphorylation site (N = 16), expressed in HEK293T cells and treated with 100 ng/mL epidermal growth factor (EGF) at t = 0 min and the MEK inhibitor U0126 at t = 25 min. (c) A summary of anisotropy changes for various color-variants of FLARE-EKAR, upon stimulation with 100 ng/mL EGF. The magnitude of the signal was calculated by taking the mean anisotropy from t = 10 min to t = 15 min and subtracting the mean anisotropy of the baseline before drug addition.

Figure 2—figure supplement 2. Characterization of the CKAR2 hetero-FRET biosensor.
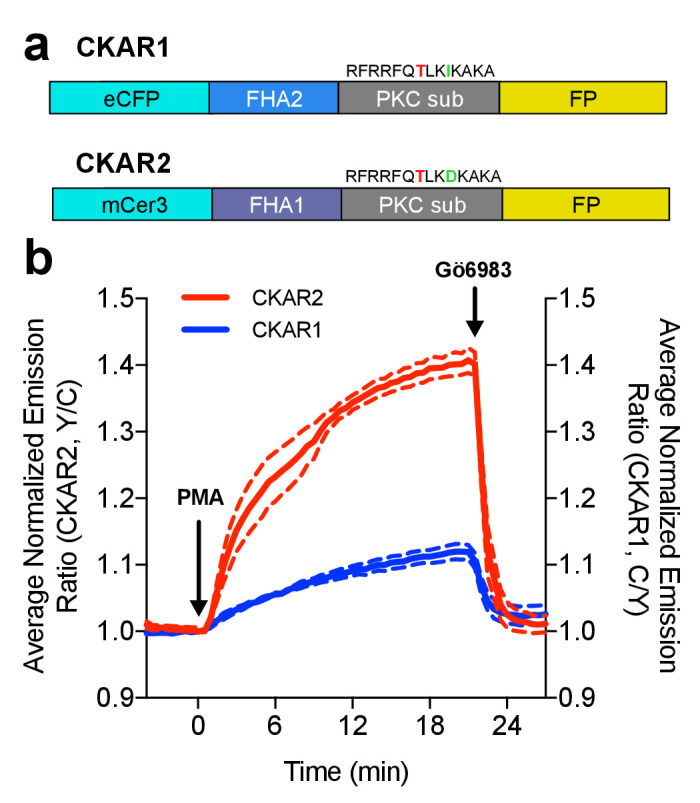
Figure 2—figure supplement 2.

(a) Comparison of CKAR1 and CKAR2 domain structures. (b) Comparison of FRET responses of CKAR1 and CKAR2 expressed in HeLa cells to Protein Kinase C (PKC) stimulation with 50 ng/mL phorbol 12-myristate 13-acetate (PMA) as well as PKC inhibition with 1 μM Gö6983. Curves here represent mean curves from one representative experiment with biological replicates N = 7 for CKAR1 and N = 4 for CKAR2; the experiment was repeated three times.

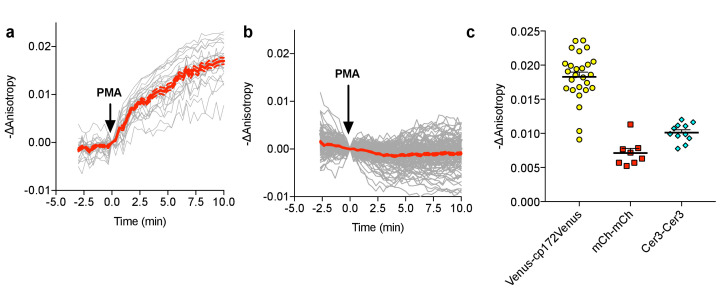
Figure 2—figure supplement 3. FLARE CKAR characterization.

Figure 2—figure supplement 3.

(a) Individual (gray) and average (red) cell traces for Venus-cp172Venus FLARE CKAR (N = 26), expressed in HEK293T cells treated with 50 ng/mL PMA at t = 0 min. Dotted lines above and below the curves reflect the standard error of the mean. (b) Individual (gray) and average (red) cell traces for the kinase-inactive mutant of Venus-cp172Venus FLARE CKAR (TA mutant) (N = 119), expressed in HEK293T cells treated with 50 ng/mL PMA at t = 0 min. (c) A summary of anisotropy changes for various color-variants of FLARE-ICUE in HEK293T cells upon stimulation with 50 ng/mL PMA. The magnitude of the signal was calculated by taking the mean anisotropy from t = 10 min to t = 11.33 min and subtracting the mean anisotropy of the baseline before drug addition.

Figure 2—figure supplement 4. FLARE MLCK characterization.

Figure 2—figure supplement 4.

(a) Individual (gray) and average (red) cell traces for FLARE MLCK (N = 13) with KCl added at t = 0 min (N = 13). (b) Individual (gray) and average (red) cell traces for FLARE-MLCK with vehicle only added at t = 0 min (N = 10). The dashed lines above and below the red curve reflect the standard error of the mean. The magnitude of the signal was calculated by taking the Δanisotropy at t = 0.33 min and subtracting the mean Δanisotropy of the baseline before drug addition.