. 2018 Jul 3;7:e35458. doi: 10.7554/eLife.35458

Figure 3. Design and characterization of FLARE second messenger biosensors.

(a) Schematic of FLARE ICUE cAMP biosensor. (b) Domain structure of FLARE-Cameleon (top). Time-course of mean fluorescence anisotropy of Venus-cp172Venus FLARE-Cameleon (N = 10) with addition of 1 μM ionomycin and 5 mM CaCl2. Summary of anisotropy changes after 1 μM ionomycin and 5 mM CaCl2 (upper right) calculated as the difference between the mean anisotropy from t = 5 min to t = 7.5 min and the anisotropy of the baseline before drug addition Representative anisotropy pseudocolor image before and after 1 μM ionomycin and 5 mM CaCl2 addition. (c) Domain structure of the cAMP biosensor FLARE-ICUE (top). Time-course of mean fluorescence anisotropy of Venus-cp172Venus FLARE-ICUE (N = 40) with addition of 50 μM forskolin and 100 μM IBMX at t = 0 (left). Summary of anisotropy changes after 50 μM forskolin and 100 μM IBMX with respect to baseline (upper right), calculated as the difference between the mean anisotropy from t = 5 min to t = 7.5 min and the anisotropy of the baseline before drug addition. Representative anisotropy pseudocolor image before (t = 0 min) and after (t = 7.5) stimulation with Fsk/IBMX (lower right). Dashed lines above and below time course reflect standard error of the mean.
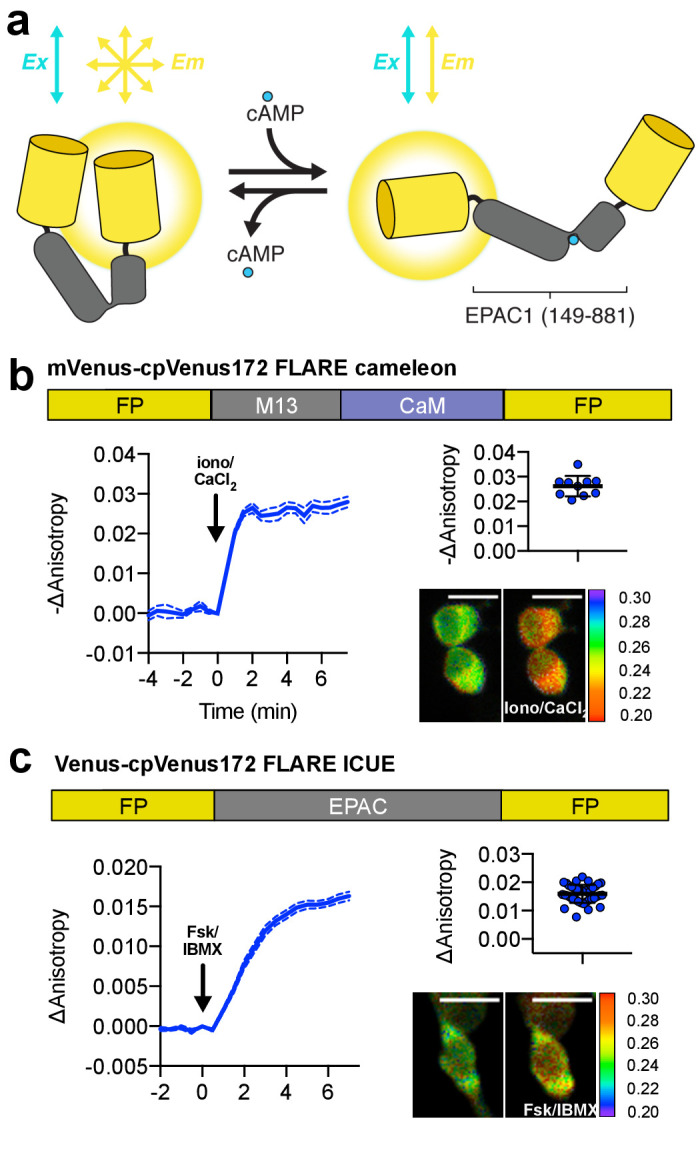
Figure 3—source data 1. FLARE second messenger biosensor panel.
(a) Sheet 1, Figure 3b. Time course for Venus-cp172Venus FLARE Cameleon. (b) Sheet 2, Figure 3b. Summary of magnitude of responses for Venus-cp172Venus FLARE Cameleon upon addition of calcium chloride and ionomycin. (c) Sheet 3, Figure 3—figure supplement 1b. Summary of magnitudes of responses for various FLARE Cameleon variants upon addition of calcium chloride and ionomycin. (d) Sheet 4, Figure 3—figure supplement 2. In vitro calibration of Venus-cp172Venus FLARE Cameleon, both raw data and sigmoidal curve fits. (e) Sheet 5, Figure 3—figure supplement 3. Summary of magnitude of anisotropy changes for CFP FLARE D1ER upon addition of ionomycin and three different doses of calcium. (f) Sheet 6, Figure 3c. Time course for Venus-cp172Venus FLARE ICUE. (g) Sheet 7, Figure 3c Summary of magnitudes of changes in anisotropy for Venus-cp172Venus FLARE ICUE upon addition of forskolin and IBMX.

Figure 3.

Figure 3—figure supplement 1. Characterization of FLARE Cameleon.

Figure 3—figure supplement 1.

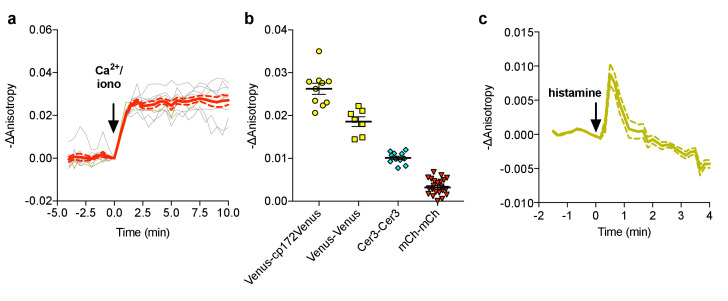
(a) Individual (gray) and average (red) cell traces for Venus-cp172 FLARE Cameleon (N = 10). (b) A summary of anisotropy changes for various color-variants of FLARE-Cameleon in HEK293T cells upon stimulation with 1 μM ionomycin and 5 mM calcium chloride. The mean for each is shown, with the error reflecting the standard error of the mean. The magnitude of the signal was calculated by taking the mean anisotropy from t = 5 min and t = 7.5 min and subtracting the mean anisotropy of the baseline before drug addition. (c) Average anisotropy trace for Venus-cp172Venus FLARE-Cameleon expressed in HeLa cells upon stimulation with histamine (100 μM). Dotted lines above and below the curves reflect the standard error of the mean.

Figure 3—figure supplement 2. In vitro calibration of purified Venus-cp172 FLARE-Cameleon.

Figure 3—figure supplement 2.

Anisotropy vs. calcium concentration calibration curves of purified Venus-cp172Venus Cameleon for (a) 25°C (b) 32°C, and (c) 37°C.

Figure 3—figure supplement 3. Characterization of CFP FLARE-D1ER.

Figure 3—figure supplement 3.

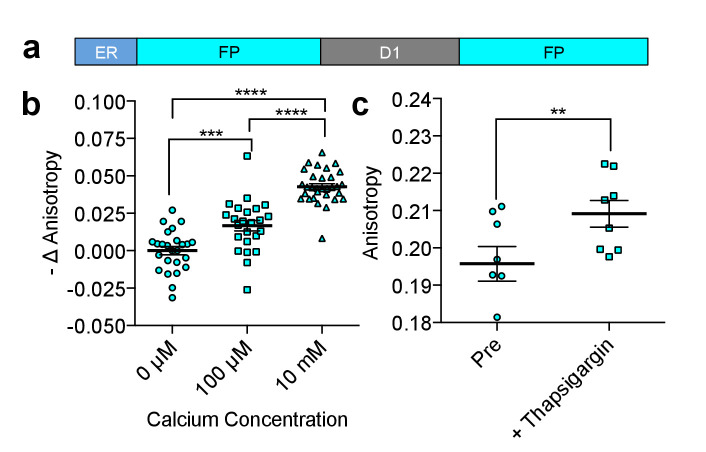
(a) Schematic of the ER calcium sensor. (b) REF52 cells expressing CFP FLARE D1ER were permeabilized using 5 μM ionomycin and equilibrated with 3 mM EGTA to remove Ca2+ or the indicated Ca2+ concentration. Fluorescence anisotropy values were normalized to the Ca2+-free condition. Statistical significance was assessed using an ANOVA and Tukey Multiple comparison test (***p<0.001, ****p≤0.0001). (c) REF52 cells expressing CFP FLARE D1ER were treated with thapsigargin (1 uM, 5 min), to reduce ER Ca2+ levels (N = 8, **p<0.01 by t-test). The mean for each of the above is shown, with the error reflecting the standard error of the mean.

Figure 3—figure supplement 4. Venus-cp172Venus FLARE ICUE single cell traces.
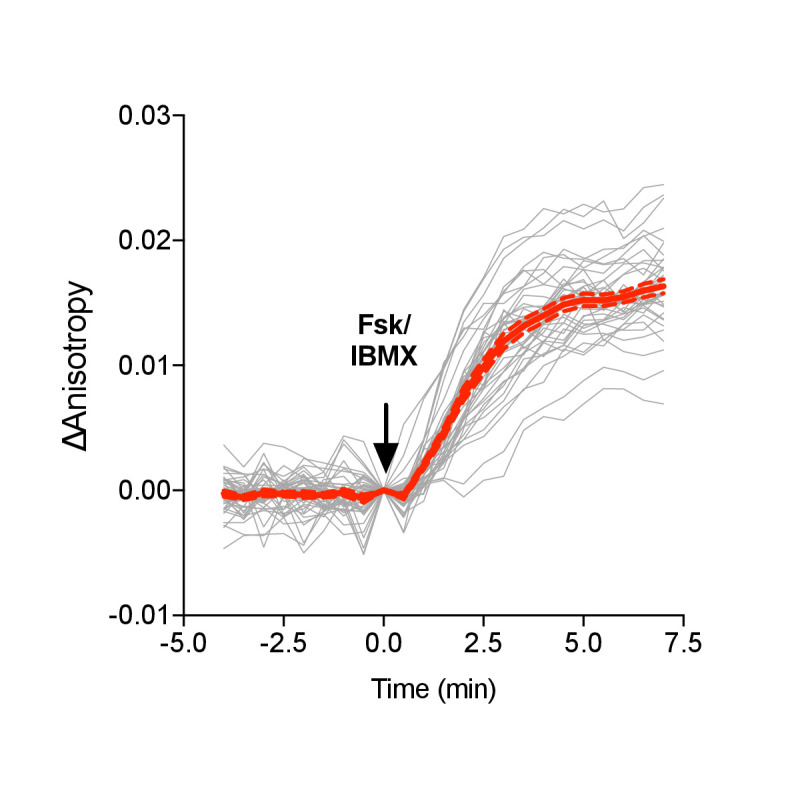
Figure 3—figure supplement 4.

(a) Individual (gray) and average (red) cell traces for Venus-cp172Venus FLARE-ICUE (N = 40). Dashed lines above and below the average curve reflect the standard error of the mean.