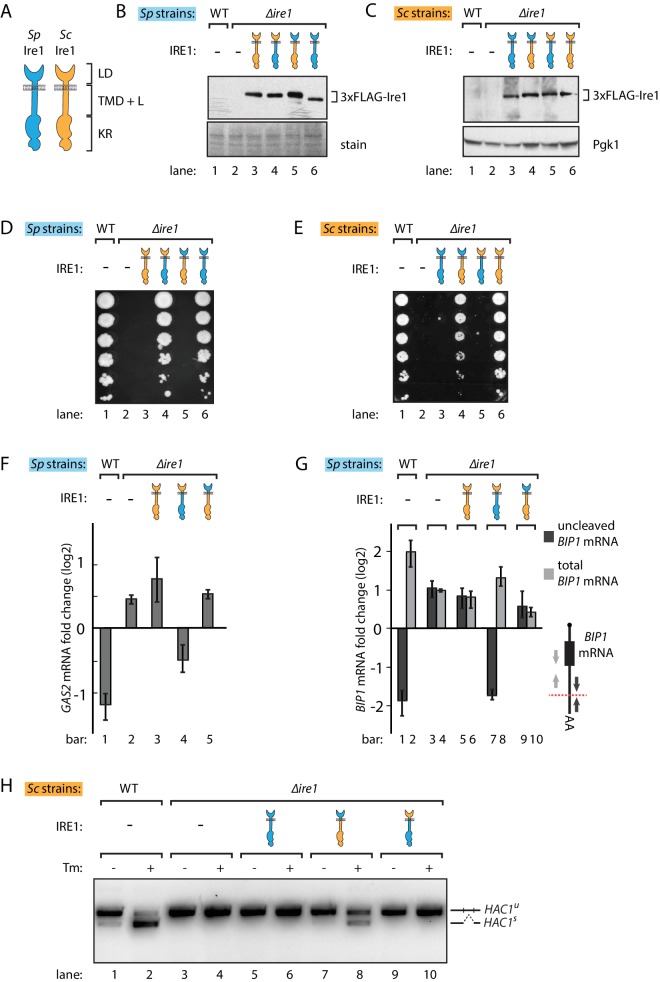
Figure 1. S. pombe and S. cerevisiae Ire1 have functionally conserved stress sensing ER-lumenal domains and divergent cytosolic domains.
(A) Cartoon illustration of lumenal domain (LD), transmembrane/cytosolic linker domain (TMD + L) and kinase/RNase domain (KR) for S. pombe (Sp) (blue) and S. cerevisiae (Sc) Ire1 (orange). (B, C) Expression levels of S. cerevisiae Ire1 (128 kD), S. cerevisiae lumenal S. pombe cytosolic Ire1 (126 kD), S. pombe lumenal S. cerevisiae cytosolic Ire1 (125 kD) and S. pombe Ire1 (122 kD) in S. pombe (B) and S. cerevisiae cells (C). Extracts were immunoblotted for 3xFLAG-Ire1. Ponceau stain (B) or Pgk1 (C) was used as loading control. (D, E) Cell growth assay on tunicamycin (Tm) plates. Serial dilutions of S. pombe (D) or S. cerevisiae (E) cells, which expressed the indicated Ire1 constructs, were spotted onto plates containing 0.05 μg/ml (D) or 0.1 μg/ml (E) of Tm. Plates were photographed after incubation at 30°C for 4 days. (F, G) qPCR assay for S. pombe GAS2 (F) or BIP1 (G) mRNA fold change upon 1 μg/ml Tm treatment for 1 hr. Experiments were done in triplicates. In (G), uncleaved (dark grey) or total (light grey) BIP1 mRNA was detected using the corresponding PCR primers illustrated as arrows in the schematic insert. The red dashed line indicates the Ire1 cleavage position on BIP1 mRNA. (H) Detection of S. cerevisiae HAC1 mRNA splicing by RT-PCR across the splice junction. Cells were treated with or without 1 μg/ml of Tm for 1 hr.


