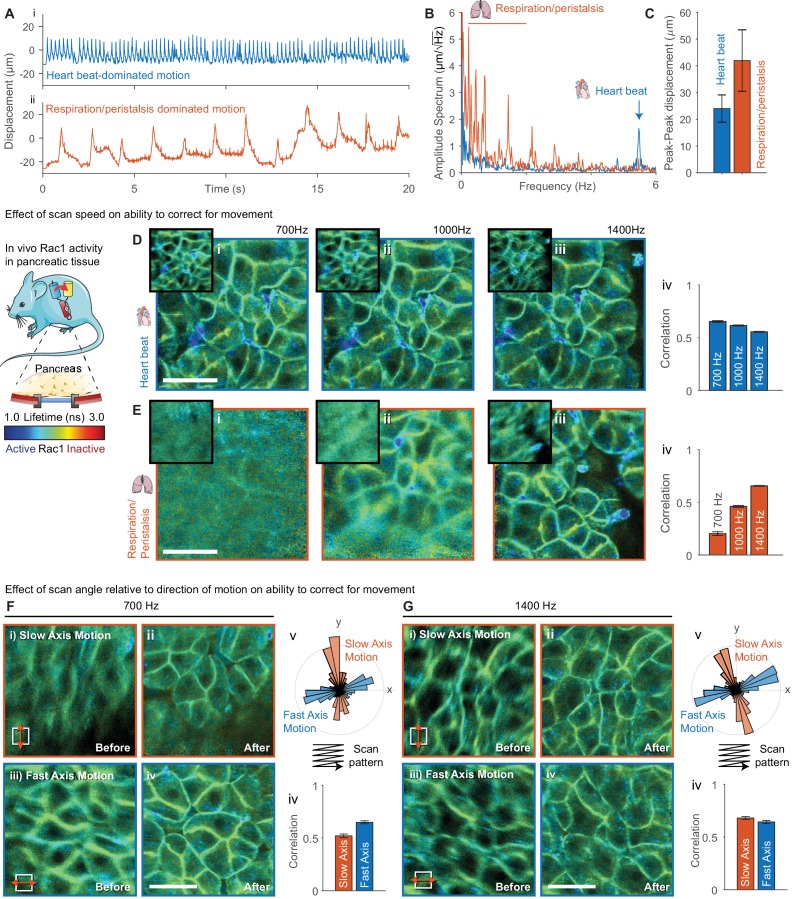
Figure 3. Evaluation of effect of scan speed and angle on motion correction performance.
(A) Imaging of pancreatic tissue in vivo in a Rac1 FRET biosensor mouse using an abdominal titanium imaging window. (A) Estimated displacement for first 20 s of motion (i) dominated by heartbeat and (ii) dominated by respiration and peristalsis recorded at 1400 Hz. (B) Amplitude spectrum of displacements for two data series showing dominant contributions from the heartbeat (~5.6 Hz) and respiration and peristalsis (0.5–2.5 Hz). (C) Peak-to-peak displacements for the data series. Error bars show standard deviation over series. (D,E) Motion corrected FLIM images acquired in (D) heartbeat dominated regime and (E) respiration dominated regime at (i) 700 Hz, (ii) 1000 Hz and (iii) 1400 Hz, (iv) average correlation of corrected frames over series. (F,G) FLIM data were acquired with predominant motion occurring along the slow scan axis (red, top-bottom) and fast scan axis (blue, left-right) at (F) 700 Hz and (G) 1400 Hz. FLIM images are shown (i) before and (ii) after motion correction for motion along the slow axis and (iii) before and (iv) after motion correction for motion along the fast axis. (v) Angular histogram of displacements for data acquired along the slow and fast axis. (iv) Average correlation of data acquired with motion aligned along the slow and fast axis. White scale bars 100 μm. Mouse and pancreas illustrations were adapted from Servier Medial Art, licensed under the Creative Commons Attribution 3.0 Unported license.


