. 2018 Jul 9;7:e35800. doi: 10.7554/eLife.35800

Figure 4. FLIM of intestinal crypts from the Rac1-FRET biosensor mouse in vivo and ex vivo using motion compensation.

(A) Imaging of intestinal crypts in vivo using an abdominal titanium imaging window (i–ii) Example FRET biosensor activity maps (i) before and (ii) after motion compensation showing fraction of active FRET biosensor determined by fitting to a FRET model accounting for the complex exponential decay of ECFP. White scale bars, 50 μm. (iii) Estimated displacement traces in (blue) x and (red) y directions over time. Pastel shaded regions indicate frames that could not be successfully corrected with correlation coefficients < 0.8. (iv) Correlation between reference frame and (red) uncorrected and (blue) corrected images over time. Black dashed line denotes threshold (0.8) used to reject frames which could not be corrected. (v) Selected reference frame (vi,vii) Example of a successfully corrected frame (vi) before and (vii) after correction. (viii,ix) Example of a frame that could not be corrected. (B) Imaging of intestinal crypts ex vivo. (i–iv) as (A), no correlation threshold applied. (C) (i) Phasor plot of image shown in (B) to separate biosensor fluorescence (blue) from autofluorescence (red) and i) back projection of selected gates. (D) Intensity merged lifetime images of crypts (i) before and (ii) after motion compensation treated with (left-right) no drug, 200 nM PMA or 1 μM scopolamine. White scale bars 50 μm. (E) Quantification of fraction of active biosensor in crypts after drug treatment. (F) Subcellular analysis of fraction of active biosensor in basal (blue) and apical (red) membranes after drug treatment, shown per cell. Error bars show means ± SEM. **p<0.01; ***p<0.001 using one-way ANOVA. Mouse and intestine illustrations were adapted from Servier Medial Art, licensed under the Creative Commons Attribution 3.0 Unported license.

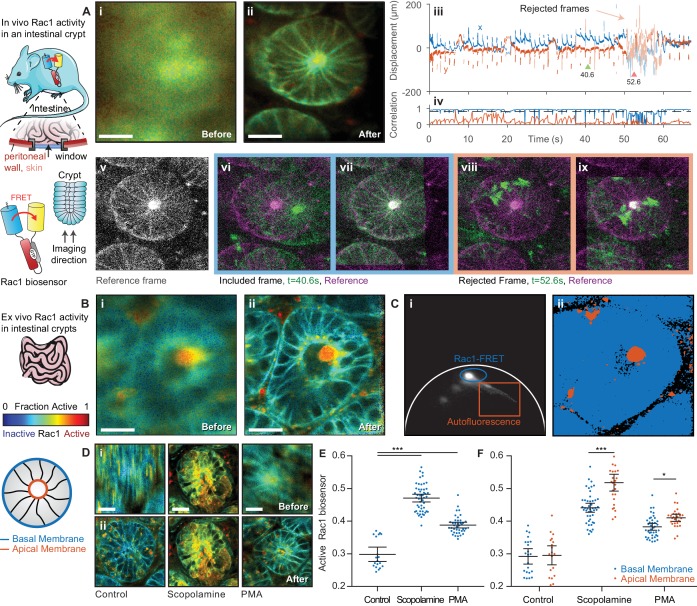
Figure 4—source data 1. Source data for graphs show in Figure 4E and F.
(Sheet 1) Fraction of active Rac1-FRET biosensor in each cell. (Sheet 2) Fraction of active Rac1-FRET biosensor in the basal and apical membrane respectively per cell.
DOI: 10.7554/eLife.35800.012
Figure 4—source data 2. Source data for graph show in Figure 4—figure supplement 1C, showing (Sheet 1) average optical densities for active-Rac1 IHC staining per mouse and (Sheet 2) individual optical densities for active Rac1 IHC staining per cell for each mouse.
elife-35800-fig4-data2.xlsx (395.2KB, xlsx)
DOI: 10.7554/eLife.35800.013

Figure 4.

Figure 4—figure supplement 1. IHC for Rac1-GTP in intestinal crypts.

Figure 4—figure supplement 1.

Freshly collected intestinal crypts were treated with a vehicle, 1 μM Scopolamine for 30 min or 200 nM PMA for 15 min and stained for Rac1-GTP. (A) Example IHC images, black scale bar, 50 μm. (B) Quantification of staining optical density in intestinal crypt cells, averaged over n > 1,500 cells per condition. Results show mean ± SEM (shaded) over n = 3 mice. p values were determined per-mouse using non-parametric one way ANOVA; *p<0.05.
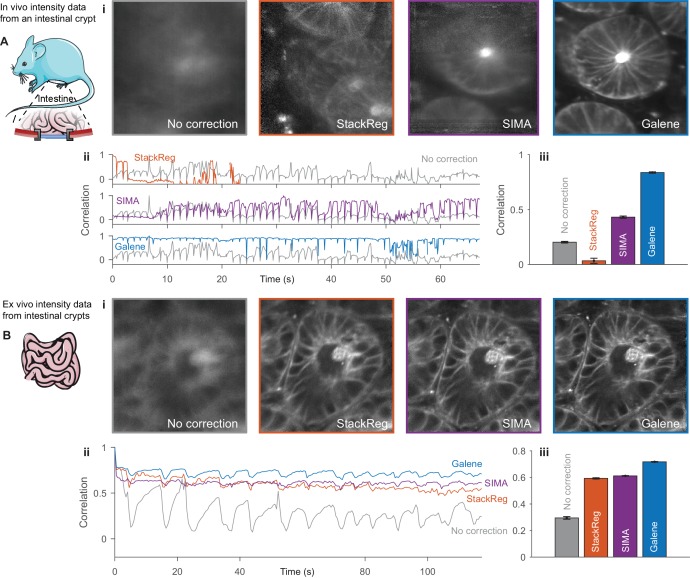
Figure 4—figure supplement 2. Benchmarking of intensity-only motion correction performance with frames from intestinal crypts.

Figure 4—figure supplement 2.

Intensity frames were extracted from the FLIM images of intestinal crypts shown in Figure 4 imaged (A) in vivo through an optical window and (B) ex vivo for benchmarking against alternative motion correction packages. (i) Frame averaged motion correction results with (gray) no correction, (red) ImageJ plugin StackReg, (purple) python package SIMA and (blue) Galene. No frames were excluded from the averaging. (ii) Correlation between each frame in the sequence and the reference frame for each package. (iii) Average correlation for each correction package. Results show mean ± SEM. Mouse and organ illustrations were adapted from Servier Medial Art, licensed under the Creative Commons Attribution 3.0 Unported license.