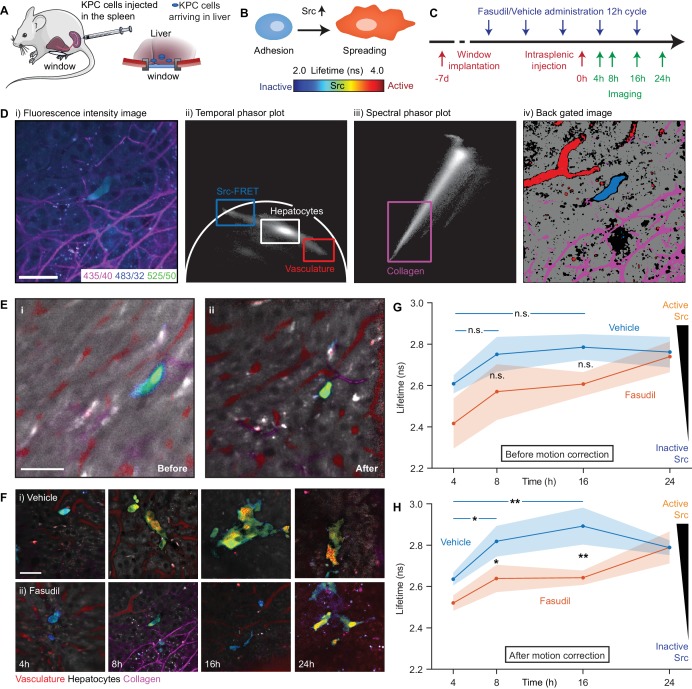
Figure 5. Longitudinal imaging of Src activity in cancer cells colonising the liver in an intrasplenic model of pancreatic cancer metastasis with micro-environmental context in response to priming with Fasudil.
(A) Cartoon of intrasplenic model of pancreatic cancer using KPC cancer cells expressing a Src-FRET biosensor. (B) Cartoon of morphology of KPC cells during early attachment events. (C) Experimental timeline showing timings of window implantation, intrasplenic injection, Fasudil (or vehicle) administration and imaging. (D) Illustration of identification of fluorescence components; (i) merged spectral intensity image, (ii) temporal phasor plot of 525/50 nm channel with gates used to select fluorescence components, (iii) spectral phasor plot, (iv) back projection image showing gates highlighted in (ii) and (iii). (E) Merged Src-FRET biosensor lifetime and hyperspectral unmixing image i before and (ii) after motion correction acquired 8 hr after intrasplenic injection. Cancer cells expressing the Src biosensor are colour-coded using the rainbow lifetime scale. Autofluorescence contributions obtained using hyperspectral unmixing shown in (red) vasculature, (grey) hepatocytes and (magenta) collagen. (iii) Estimated displacement traces in (blue) x and (red) y directions over time. (iv) Correlation between reference frame and (red) uncorrected and (blue) corrected images over time. (F) (i,ii) Example images showing Src activity and micro-environmental context in mice treated with (i) vehicle and (ii) 100 mg/kg Fasudil according to the timeline show in (C) at 4, 8, 16 and 24 hr after intrasplenic injection respectively. (G,H) Average Src biosensor lifetime in cancer cells colonising the liver in response to Fasudil treatment, using images (G) before and (H) after motion correction. n = 3 mice per condition, 20–45 cells per time point. Results show means ± SEM (shaded). p values were determined per-mouse by unpaired t-test, *p<0.05; **p<0.01. Mouse and liver illustrations were adapted from Servier Medial Art, licensed under the Creative Commons Attribution 3.0 Unported license.

