
Figure 1.
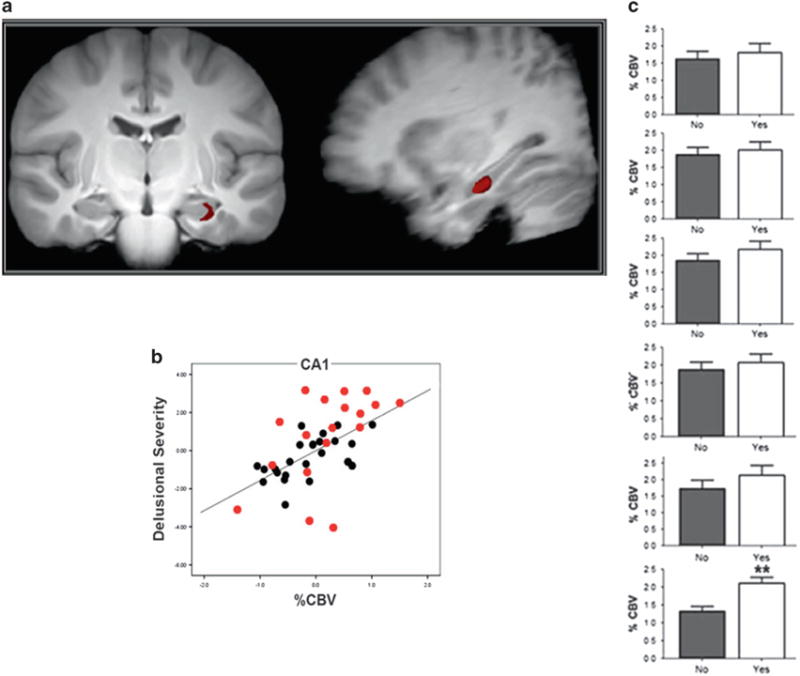
(a) Coronal and sagittal MR images showing specific left hippocampal CA1 subregion with elevated CBV in high risk patients as compared to healthy volunteers. (b) Scatterplot showing the relationship between psychotic symptoms (delusional severity, hallucinations not shown) and left hippocampal CA1 CBV in high risk (black) and schizophrenia (red) patients. (c) Bar graph of CBV values in left hippocampal CA1 subregion ranging from posterior (top) to anterior (bottom) showing significantly increased activity of latter in patients who progressed to psychotic disorders and those who did not.