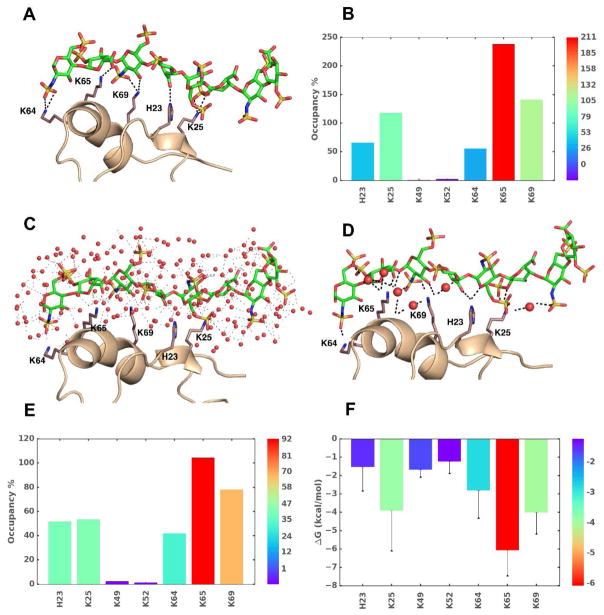
Figure 3.
The use of MD in understanding GAG–protein interactions. Analyzes of MD trajectories over a timescale of few picosec to hundreds of microsec affords a wealth of thermodynamic and kinetic information on GAG–protein co-complexes. Shown are results for an exemplary system, heparin octasaccharide (HS08) binding to CXCL5 in water (A-F). A) The observed intermolecular hydrogen bonds (H-bonds, broken black lines) between donors and acceptor atoms of GAG and side chains of amino acids at a given time frame. B) Percent occupancy of H-bonds between key amino acid residues with HS08 is shown (higher (red) to lower (blue)). C) A representative MD frame showing the bed of heterogeneous water molecules surrounding interacting regions. The distribution of water engineers GAG–water, water–water, protein–water, protein–GAG–water H-bonds. Water molecules are represented as red spheres and interactions are shown as faint black dashed lines. D) Significant number of interactions arise from water mediated H-bonds (i.e., not direct) between GAG and protein, as shown. E) Shown is the overall occupancy of water mediated H-bond interactions between GAG and protein. F) Single residue energy decomposition (SRED) of interacting amino acids in the co-complex as deduced by MM-PBSA/MM-GBSA method.

