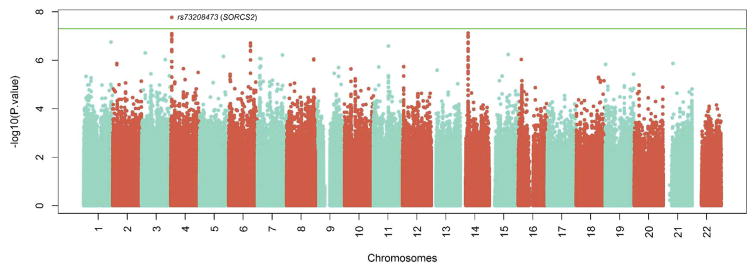
Figure 2.
Manhattan plot of the GWAS results from the meta-analysis of ATV exposure. The genomic position for each SNP for 22 autosomes are plotted along the x-axis, and the values on the y-axis denote the –log10-transformed and λ-adjusted p-values from the meta-analysis of the associations with ATV hair level for each of the SNPs present in ≥ 240 WIHS participants. The green line denotes the a priori threshold for genome-wide significance (p = 5x10⁻⁸).

