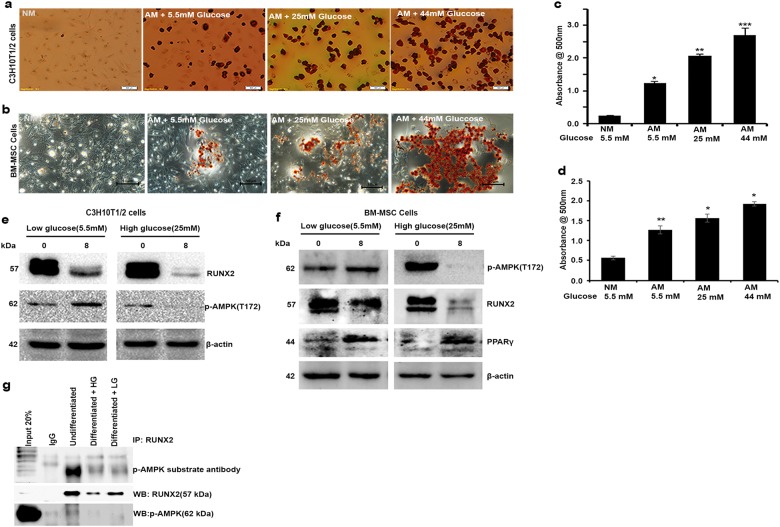
Fig. 4. High glucose-induced adipogenic differentiation depends upon status of AMPK.
MSCs (C3H10T1/2 & BM-MSCs) were exposed to various indicated concentrations of D (+) glucose along with adipogenic inducers. a, b Oil Red O stain shows glucose concentration (25 and 44 mM)-dependent increased adipogenesis compared with normal glucose (5 mM) and without adipogenic-induced medium (NM). c, d Representative picture showing the quantitative measurement of Oil Red O stain eluted with 100% isopropanol (n = 3). e, f Western blot analysis of p-AMPK and RUNX2 shows loss of AMPK activation and RUNX2 protein stability in high glucose-treated cells. g Immunoprecipitation analysis of undifferentiated and differentiated MSCs to adipogenesis with 5.5 mM (LG) and 25 mM (HG) concentrations of glucose showing the reduced levels of RUNX2, p-AMPK and RUNX2-S118 phosphorylation with p-AMPK substrate antibody. Mean ± S.E.M.; n = 3, *p < 0.1 versus NM+5.5 mM glucose control; **p < 0.05 versus NM+5.5 mM glucose control; ***p < 0.001 versus NM+5.5 mM glucose control

