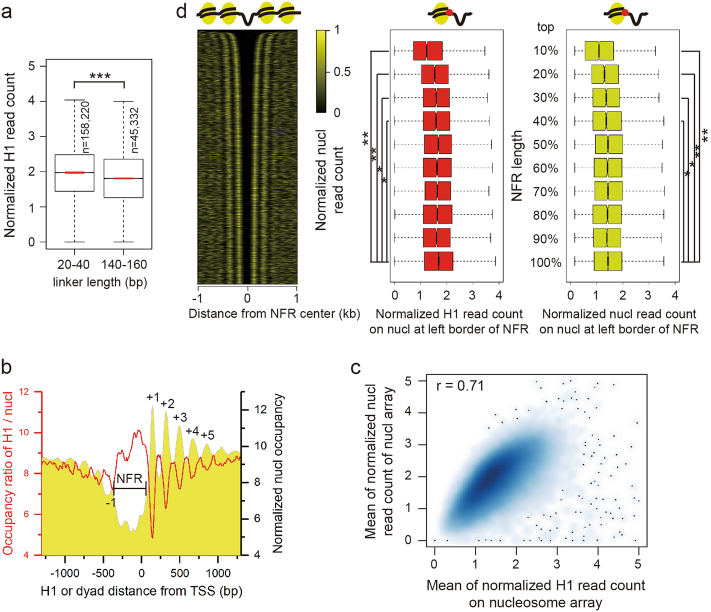
Fig. 2. Correlation between H1 occupancy and nucleosome spacing.
a H1 occupancy on short (20–40 bp) and long (140–160 bp) linkers corresponding to the bimodal peaks (see Supplementary Figure 2a) (***p-value < 0.001, two-sided permutation test). b Occupancy ratio of H1 to genic nucleosome in the regions closer to TSS is significantly lower than the farther downstream regions (p < 0.001, two-sided permutation test). The canonical -1, NFR, +1, +2, +3, etc. nucleosome organization around TSS is shown as a golden backdrop. c Scatter plot shows the positive correlation between H1 occupancy and average nucleosome occupancy of nucleosome arrays. d H1 occupancy is negatively correlated with NFR length. Left: heatmap shows the nucleosome organization around NFRs descendingly ordered by NFR length. Middle: H1 occupancy on the nucleosomes at the left border of NFRs grouped by NFR length. Right: Nucleosome occupancy on the nucleosomes at the left border of NFRs grouped by NFR length. H1 or nucleosome occupancy in the top four groups of NFRs is significantly lower than the group of NFR with the shortest length (*p-value < 0.05, **p-value < 0.01, two-sided permutation test). There are total 38,938 NFRs

