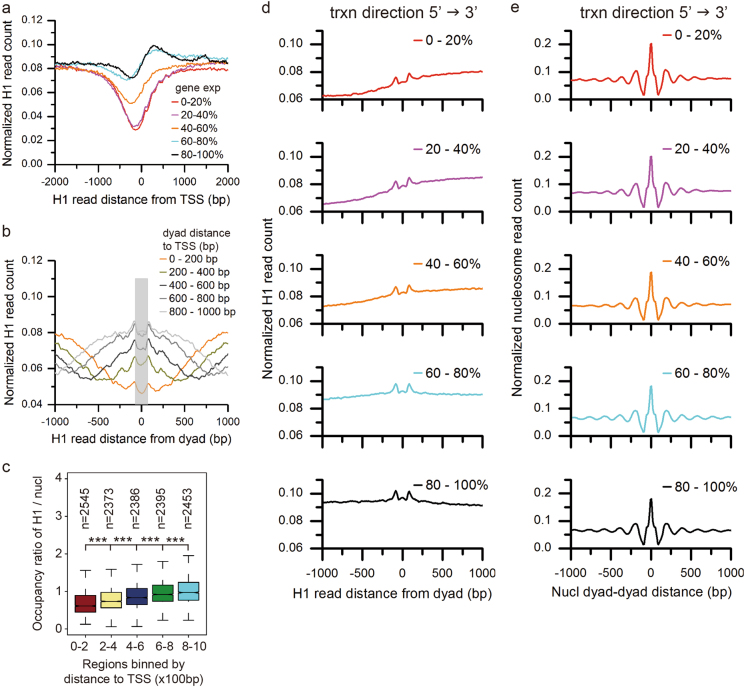
Fig. 5. Gene expression-dependent asymmetrical H1 placement on nucleosomes in the genic body.
a The distribution of H1 around TSS categorized by gene expression levels (top 20%, 20–40%, 40–60%, 60–80%, and 80–100%). b The distribution of H1 occupancy on genic nucleosomes grouped by the dyad distance to TSS with top 20% of gene expression levels. The gray bar indicates the nucleosome location. c Occupancy ratio of H1 to nucleosome in the regions closer to TSS with top 20% of gene expression levels is significantly lower than the regions farther to TSS (***p < 0.001, two-sided permutation test). d The distribution of H1 occupancy on genic nucleosomes between the 5′ and the 3′ end of genes whose length is <3 kb, or within 0–3 kb downstream of TSS of genes whose length is ≥3 kb. The nucleosomes are further classified by gene expression levels (top 20%, 20–40%, 40–60%, 60–80%, and 80–100%). Nucleosomes are orientated from 5′ to 3′ direction according the gene where the nucleosome locates. e Relationship between the position of adjacent nucleosomes corresponding to the groups in d. The y axis shows the normalized nucleosome count with a dyad-to-dyad distance indicated on the x axis

