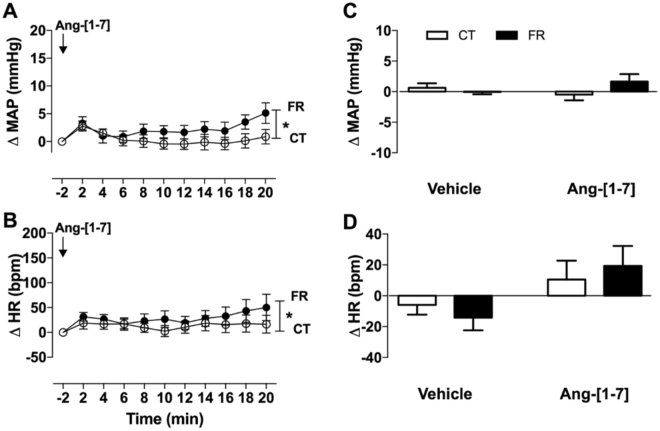
Figure 4.
Effect of FR on MAP and HR responses to infusion of Ang-[1–7]. Shown are the changes (A,B) or maximum change from baseline (C,D) in MAP (A,C) and HR (B,D) after vehicle or Ang-[1–7] infusion in CT (open circle; n = 10) and FR (closed circle; n = 9) female rats. Basal MAP (mm Hg): CT, 106 ± 1 vs. FR, 104 ± 3. Basal HR (bpm): CT, 380 ± 7 vs. FR, 358 ± 12. *P < 0.05 vs. CT by two-way ANOVA and Bonferroni post-hoc test (time; diet). Values are expressed as the mean ± SEM.

