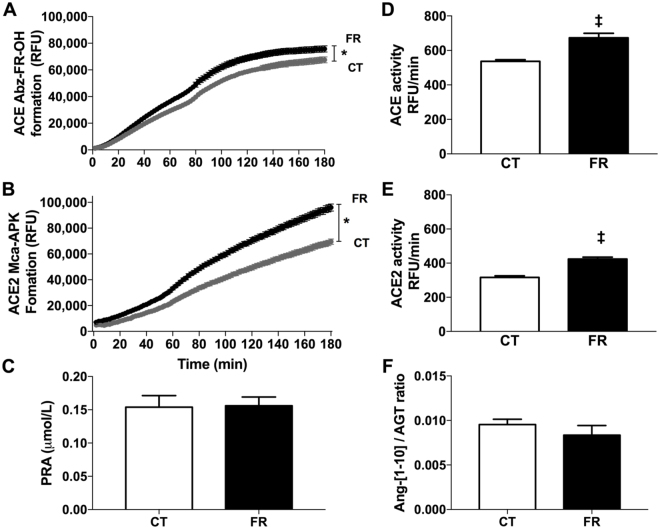
Figure 5.
Effect of FR on plasma ACE, ACE2 and renin activity. Shown is the time course of product formation (A,B) and enzyme activity (C,D,E) for ACE (n = 8/group) (A,D), ACE2 (CT, n = 8; FR = 9) (B,E) and renin (CT, n = 8; FR, n = 10) (C) in the plasma and the ratio of Ang-[1–10] over AGT production (CT, n = 10; FR, n = 11) (F) in CT (grey circle; white bar) and FR (closed circle; black bar) female rats. *P < 0.001 vs. CT by two-way ANOVA and Bonferroni post-hoc test (time; diet); ‡P < 0.0001 vs. CT, same treatment, by unpaired Student’s t-test. Values are expressed as the mean ± SEM.

