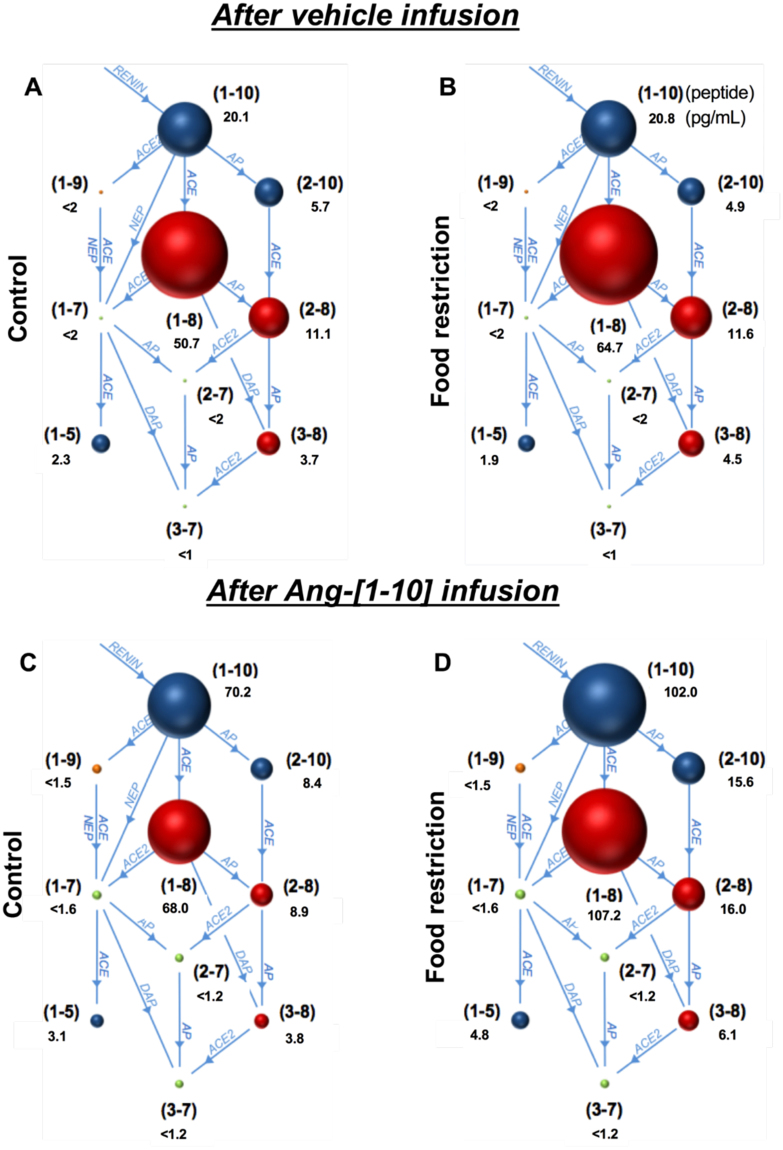
Figure 6.
Depiction of the relative effect of FR on plasma angiotensin (Ang) peptides. Shown is the RAS fingerprint of Ang peptides in CT (n = 10) (A,C) and FR (n = 11) (B,D) female rats before (A,B) and after Ang-[1–10] infusion (C,D) (n = 8/group). The numbers in parentheses refer to the specific Ang peptide with the peptide concentration (pg/mL) listed below each peptide. For example, (1–10) represents Ang-[1–10]. Red and green circles reflect biologically active and inactive Ang peptides, respectively. The relative amounts of plasma peptides are depicted by the circle volumes, which are drawn to a relative scale.

