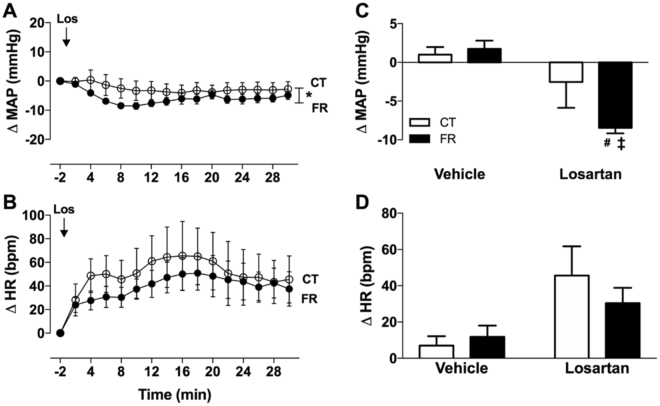
Figure 8.
Effect of FR on MAP and HR responses to infusion of losartan. Shown are the changes (A,B) and maximum change from baseline (C,D) in MAP (A,C) and HR (B,D) after vehicle or losartan (Los) treatment in CT (open circle; white bar; n = 9) and FR (closed circle; black bar; n = 10) female rats. Basal MAP (mm Hg): CT, 122 ± 2 vs. *FR, 108 ± 1. Basal HR (bpm): CT, 374 ± 18 vs. FR, 365 ± 13. *P < 0.0001 vs. CT by two-way ANOVA and Bonferroni post-hoc test (time; diet); #P < 0.05 vs. vehicle, same animal group by unpaired Student’s t-test and ‡p < 0.001 vs. CT, same treatment, by two-way ANOVA and Bonferroni post-hoc test (drug; diet); Values are expressed as the mean ± SEM.

