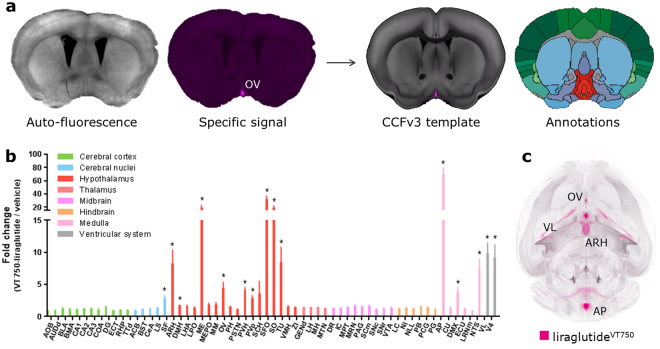
Figure 2.
Brain regions with liraglutideVT750 access. (a) Left: 2D coronal projections from data acquired with LSFM following liraglutideVT750 administration in C57BL/6J mice. The specific signal was mapped to the integrated brain atlas for quantification following auto-fluorescence background reduction by spectral unmixing. Right: 2D projection showing a mapped liraglutideVT750 signal overlaid onto the CCFv3 atlas template3. Automated quantification was achieved using the corresponding annotations. (b) Bar graph showing the mean fold change and standard deviation (SD) of the total fluorescence signal in selected brain regions comparing liraglutideVT750 and vehicle (n = 5). An asterisk marks significant difference between treatments when analyzed in individual brain regions using a false discovery rate value of 5% to correct for multiple comparisons. Note the split y-axis when interpreting results and standard deviations. See Supplementary Table 1 for full brain region names. (c) Maximum intensity projection of the average liraglutideVT750 signal computed from the individual brains in the study group (n = 5).

