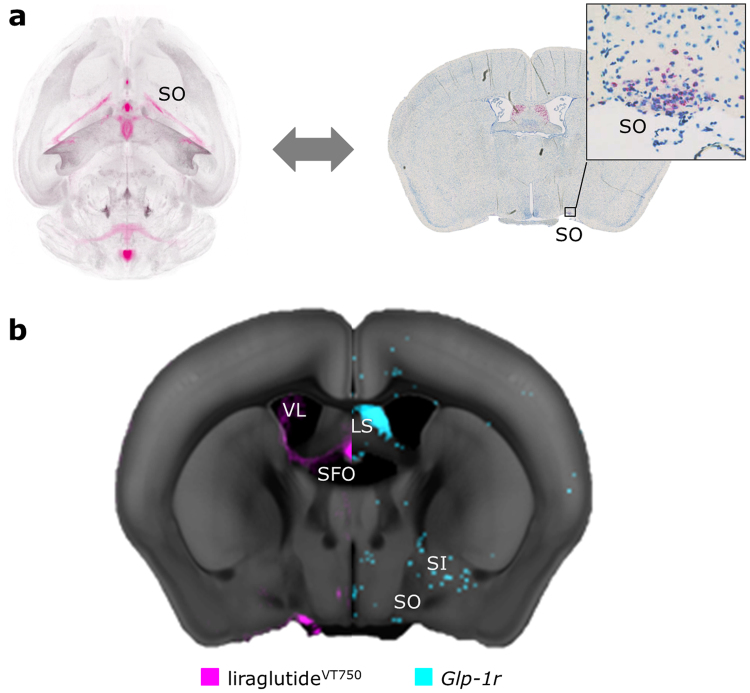
Figure 4.
Comparison of glp-1r localization and average liraglutideVT750 distribution. (a) Concept behind aligning a 2D histology ISH image (right) with 3D LSFM data (left). A histology image was aligned to an interpolated section of the integrated brain atlas template. Once aligned a similar interpolated projection from the average liraglutideVT750 distribution signal could be generated. Example ISH section with zoom panel at SO region. Red color indicates cells positive for glp-1r. (b) Heat map (blue) representation of ISH section from (a) aligned with the average liraglutideVT750 signal (pink) from Fig. 2c. The signals are overlaid onto separate halves of the CCFv3 template3.

