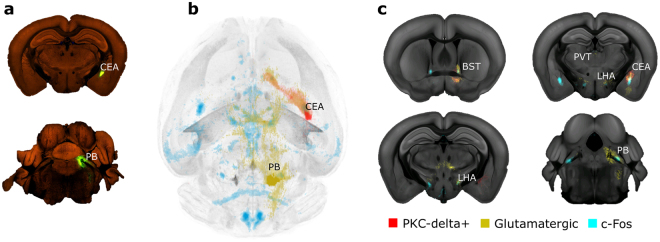
Figure 6.
Comparing brain connectivity maps with whole brain c-Fos data. (a) Top: Part of primary injection site (CEA) in a Prkcd-GluCla-CFP-IRES-Cre mouse. Bottom: Part of primary injection site (PB) in a slc17ac cre mouse. ©2011 Allen Institute for Brain Science. Allen Mouse Brain Connectivity atlas. Available from: connectivity.brain-map.org. (b) Connectivity maps visualized by horizontal maximum intensity projection overlaid with the average c-Fos increase following liraglutide administration from Fig. 5e. (c) Coronal projection images showing downloaded glutamatergic projections from PB, and PKD-delta+ projections from CEA, together with the average c-Fos increase following liraglutide administration. Signals are overlaid onto the CCFv3 template3.

