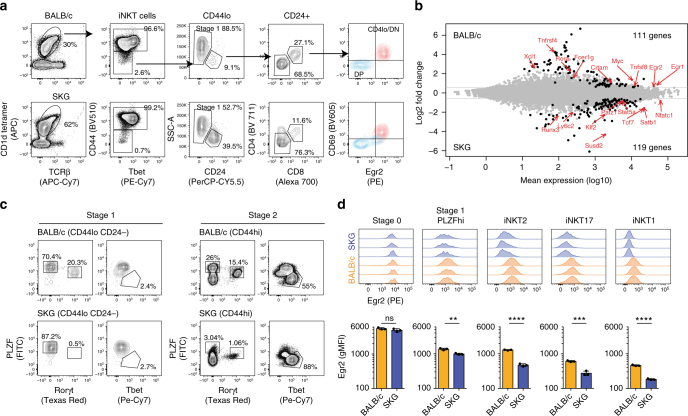
Fig. 5.
Differential gene expression in iNKT cells of BALB/c and SKG mice. a Gating strategy used to identify and sort stage 0 iNKT cells in BALB/c (top) and SKG (bottom) mice. Enrichment of iNKT cells from the thymi of BALB/c or SKG mice was achieved after staining with APC-labeled PBS57–CD1d tetramer and enrichment using anti-APC magnetic beads. Stage 0 iNKT cells were defined as TCRβ+ PBS57–CD1d tetramer+ CD44− CD24+ CD4lo CD8− CD69+. As seen on the figure, these cells are also Egr2+ (red) in contrast with the CD4+CD8+ (blue) population that invariably contaminates the cell preparation. b Mean average plot of genes expressed differentially in stage 0 iNKT cells isolated from SKG mice relative to their expression in such cells from BALB/c control mice. Data are representative of one experiment with three biological replicates per genotype. 238 genes (displayed in black) were found to be differentially expressed >1.5-fold with a false discovery rate <0.1. c Analysis of transcription factor (PLZF, Rorγt, and Tbet) expression in stage 1 (CD44− CD24−) and stage 2 (CD44+) iNKT cells from the thymi of BALB/c and SKG mice. Data are representative of >5 mice analyzed for each genotype. d Analysis of Egr2 expression level in BALB/c (orange) and SKG (purple) iNKT cells at different developmental stages. Results from three mice of each genotypes analyzed independently are shown. The mean ± SD of Egr2 gMFI in each iNKT cell developmental stage in BALB/c and SKG mice is shown. Significance was assessed using the unpaired t-test. **p < 0.01; ***p < 0.001; ****p < 0.0001; ns, not significant

