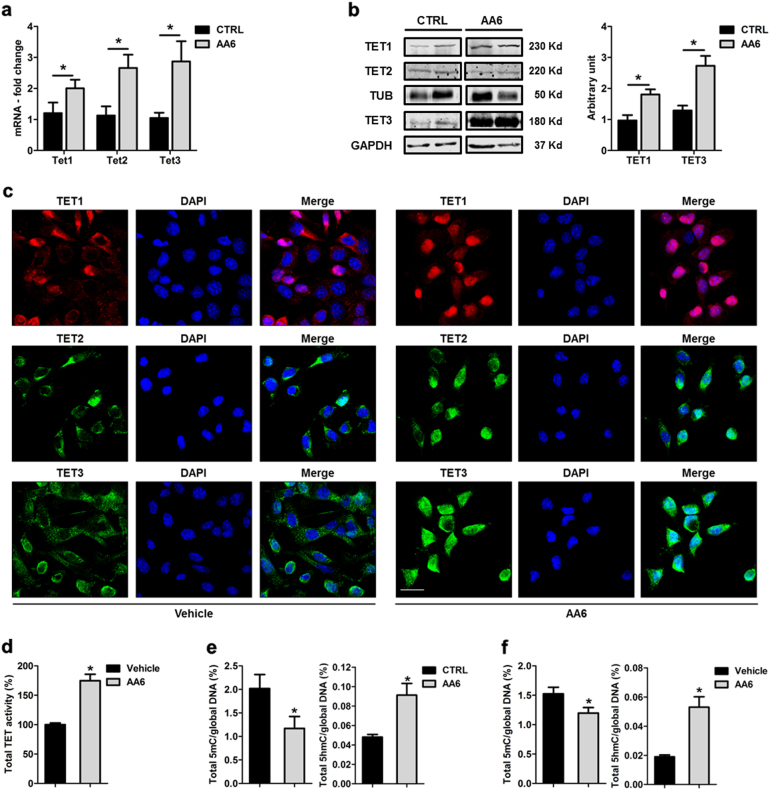
Fig. 3. KGDH inhibition increases TET expression and modulates 5mC/5hmC global levels both in vivo and in vitro.
a Ten-eleven translocation hydroxylases (Tet) -1, 2, 3 mRNA expression levels in AA6 injected mice (50 mg/kg; grey bars) and control mice (black bars); n = 5. b Representative western blot (left panel) and relative densitometry (right panel; n = 4) of TET1, 2, 3 in AA6 (50 mg/kg; grey bars) treated mice compared to controls (black bars). α-tubulin and Glyceraldehyde 3-phosphate dehydrogenase (GAPDH) were used as a loading controls. c Representative confocal images depicting the intracellular content of TET1, 2, 3 enzymes in 4T1 cells treated with AA6 (50 µM) or vehicle alone. Cells were probed by an anti-TET1 antibody (red; monoclonal), TET2 (green; polyclonal), TET3 (green; polyclonal) and counterstained by DAPI (blue). Scale bar 25 μm; n = 3. d TET activity quantification performed in 4T1 cells treated with AA6 (50 µM; grey bar) for 48 h indicated as percentage versus vehicle-treated cells (black bar); n = 3. e Quantification of 5mC (left panel) and 5hmC (right panel) global levels in 4T1-injected mice after AA6 administration (50 mg/kg; grey bars) compared to untreated mice (black bars); n = 5 each group. f Quantification of 5mC (left panel) and 5hmC (right panel) global levels in 4T1 cells exposed to AA6 (50 µM; grey bars) for 48 h indicated as fold-change versus vehicle-treated cells (black bars); n = 3 each group. Data are presented as mean ± SE; *p < 0.05 vs controls. Data were analysed by two-way ANOVA and non-parametric two-tailed paired Student’s t-test

