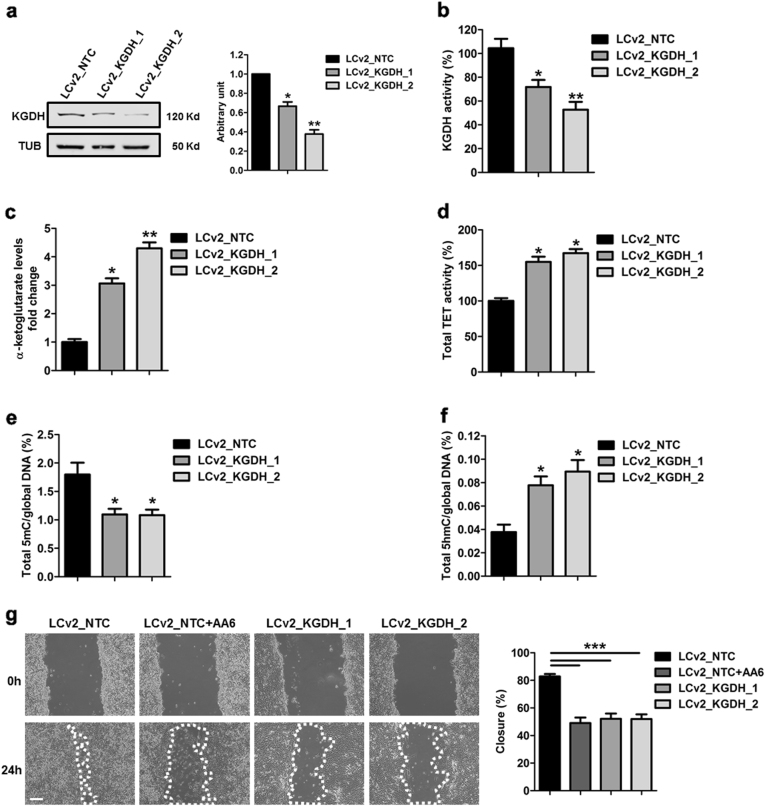
Fig. 4. CRISPR/Cas9 KGDH inactivation increases α-KG levels, TET activity and global 5hmC and interferes with 4T1 cell line biological properties.
a Representative WB (left panel) and relative densitometry (right panel) of KGDH protein levels in 4T1 cells after CRISPR/Cas9 inactivation of KGDH (LCv2_KGDH_1 and LCv2_KGDH_2) compared to control vector (LCv2_NTC). α-tubulin was used as a loading control; n = 5. b KGDH activity and c α-KG level quantification of LCv2_NTC- (black bars), LCv2_KGDH_1- (dark grey bars) and LCv2_KGDH_2- (light grey bars) 4T1 cells; n = 3 each group. d TET activity quantification performed in LCv2_KGDH_1- (dark grey bar) and LCv2_KGDH_2- (light grey bar) 4T1 cells compared to LCv2_NTC (black bar); n = 3. e Global 5mC and f 5hmC levels in 4T1 cells after CRISPR/Cas9 inactivation of KGDH (LCv2_KGDH_1 and LCv2_KGDH_2; grey bars) compared to control vector (LCv2_NTC; black bars); n = 3 each group. g Representative phase contrast microscopy images (left panel) and relative percentage of closure measurements (right panel) showing 4T1 cells motility after CRISPR/Cas9 inactivation of KGDH (LCv2_KGDH_1; medium grey bar and LCv2_KGDH_2; light grey bar) compared to control vector (LCv2_NTC; black bar) in the presence or absence of AA6 (50 µM; dark grey bars). Scale bar 100 μm; n = 3 each condition. Data are presented as means ± SE; *p < 0.05, **p < 0.005, ***p < 0.0005 vs controls. Data were analysed by non-parametric two-tailed paired Student’s t-test

