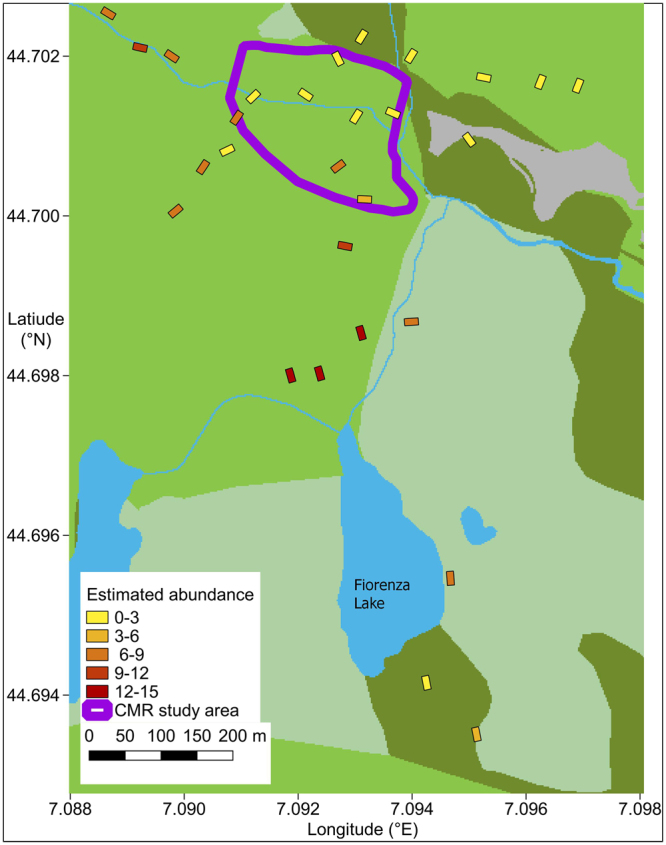
Figure 1.

Plots used to assess the abundance of Salamandra lanzai, and spatial variation of abundance estimates. The violet line is the approximate limit of the area sampled with capture-mark-recapture42. The map was generated by GFF using the open-source software QGis 2.18 (QGIS Development Team, 2016. QGIS Geographic Information System. Open Source Geospatial Foundation Project. www.qgis.org); background colors represent land use (grey: built-up; green: pasture; pale green: sparse vegetation; dark green: high-altitude pasture and moorland; blue: water).
