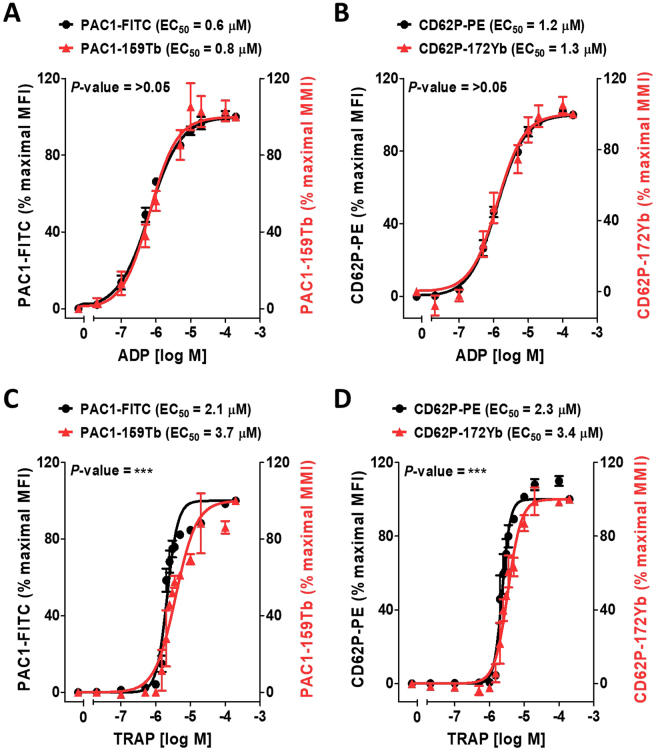
Figure 2.
Comparing MC and FFC platforms for measurement of agonist-stimulated integrin αIIbβ3 activation (PAC1) and P-selectin expression (CD62P) on platelets. Citrate-anticoagulated blood from 3 separate healthy donors was treated with vehicle or the indicated concentrations of ADP (A,B) or TRAP (C,D); for 30 minutes in the presence of PAC1-FITC or PAC1-159Tb antibodies to assess integrin αIIbβ3 activation (A,C) and CD62P-PE or CD62P-172Yb antibodies to assess α-granule secretion (B,D). Samples were fixed in 1% formaldehyde and analyzed by MC or FFC. Data were analyzed using a non-linear fit of log agonist vs. response; variable slope in GraphPad Prism 5. Results are expressed as a percentage of mean metal intensity (MMI; mass cytometry readout) or the mean fluorescence intensity (MFI; flow cytometry readout) achieved with 200 µM ADP or TRAP, respectively (means ± SEM; n = 2/3, with n = 2 accounting for the linear region of the TRAP dose-response [concentrations 1.5–3.5 µM] and n = 3 accounting for all other concentrations [0–1 µM & 5–200 µM]). Statistical analysis: an extra sum-of-squares F test was used to determine whether the EC50 values of the curves differed significantly; ***P < 0.001. Abbreviations: ADP, adenosine diphosphate; FFC, fluorescence flow cytometry; FITC, fluorescein isothiocyanate; MC, mass cytometry; PE, phycoerythrin; TRAP, thrombin receptor activating peptide.

