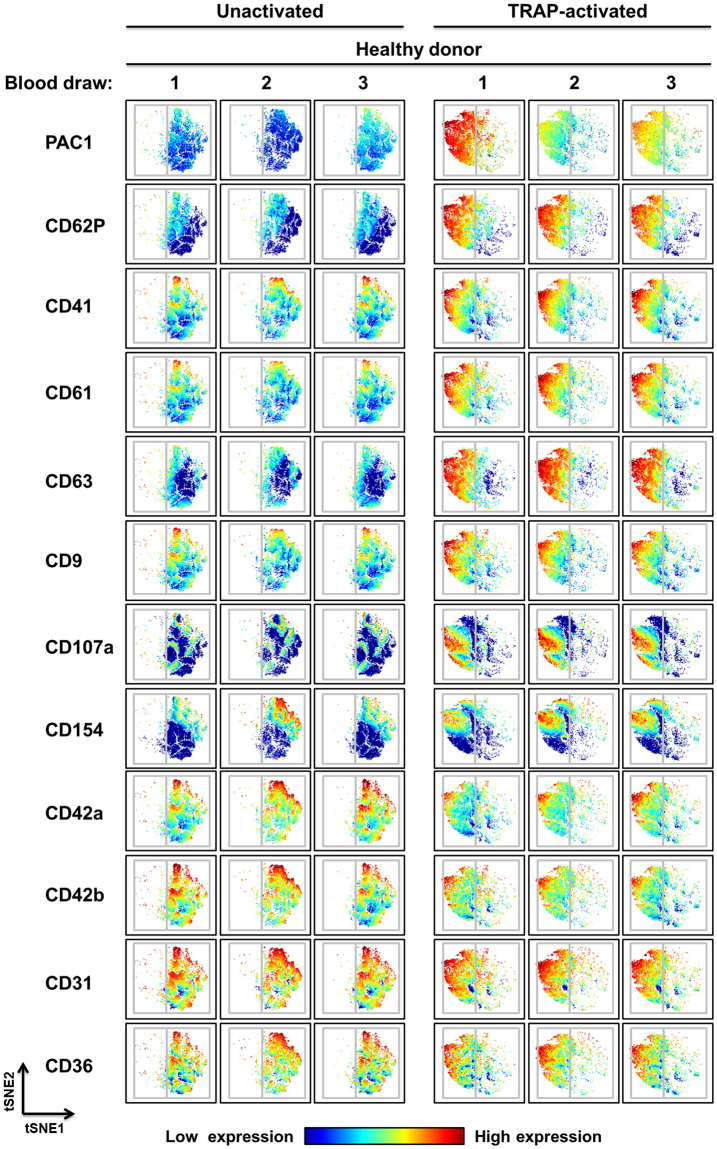
Figure 4.
Multidimensional analysis of platelet subpopulations by MC reveals heterogeneity in healthy donor samples. Visual stochastic neighbor embedding (viSNE) plots of whole blood samples drawn on 3 separate days from the same healthy subject (a different healthy subject from the healthy subjects analyzed in Figs 2 and 3). Samples were stained with a metal-tagged antibody cocktail containing 12 markers (directed against: CD9, CD31, CD36, CD41, CD42a, CD42b, CD61, CD62P, CD63, CD107a, CD154 and activated integrin αIIbβ3), treated with vehicle or 20 µM TRAP, and analyzed using MC. Color intensity relates to antigen expression (low [blue] or high [red]) and each dot represents an individual platelet. The distance between dots/platelets and populations of dots/platelets is inversely proportional to how closely related those dots/platelets are in terms of antigen expression and characteristics. Abbreviations: TRAP, thrombin receptor activating peptide; tSNE, t-distributed stochastic neighbor embedding.

