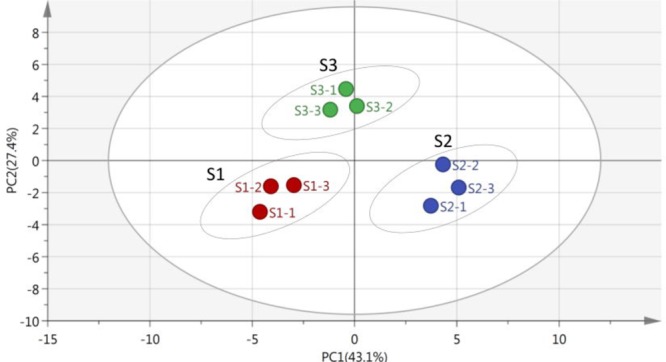
FIGURE 3.

Principal component analysis (PCA) of stored rice microbial communities on the 8th day, the axis of principal component 1 (PC1) described 43.1% and principal component 2 (PC2) described 27.4% of total data variability. The position of the points directly reflected the different metabolic functions of stored rice microbial communities in the principal vector space after dimension reduction (the original data available in Supplementary Table 3).
