Fig. 7.
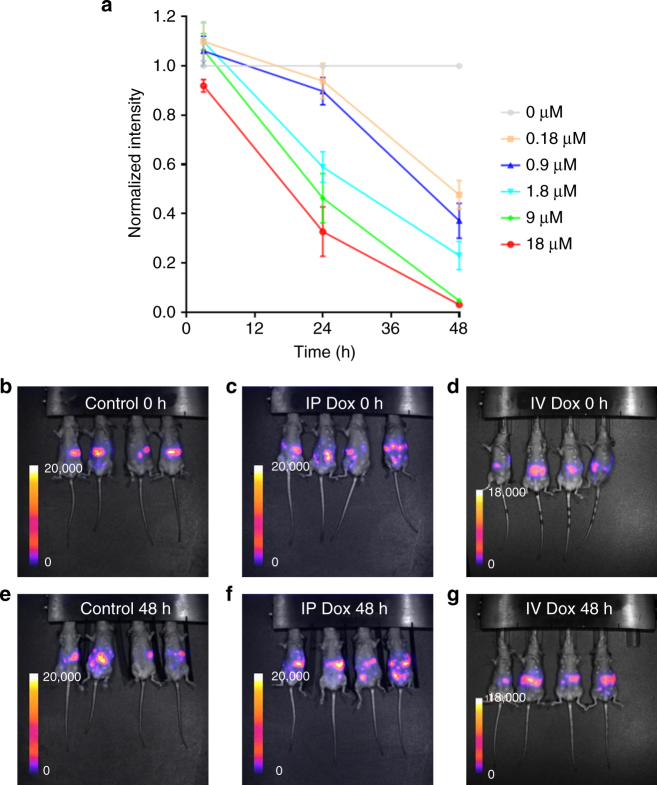
Differential doxorubicin efficacy in vivo and in vitro. a Chart shows effect of 0, 0.18, 0.9, 1.8, 9, and 18 μM doxorubicin treatment on the viability of IGROV-1 stably expressing luciferase in vitro. Viability was assessed by luciferase activity in 24-well plate (1 × 10⁵ cells well−1). Each data point represents the average intensity relative to that for 0 μM plotted at time = 0 h. The error bars represent the s.d. for n = 3 biological replicates i.e., three 24-well plates. b–g images show the effect of doxorubicin on IGROV-1 tumor burden in vivo. b–d show luciferase imaging of mice immediately (0 h) following control (b), intraperitoneal (c) or intravenous (d) injection with control PBS or 5 mg kg−1 doxorubicin. e–g show the corresponding sets of mice 48 h postinjection. Biological replicates of n = 4 mice were used for each luciferase imaging condition

