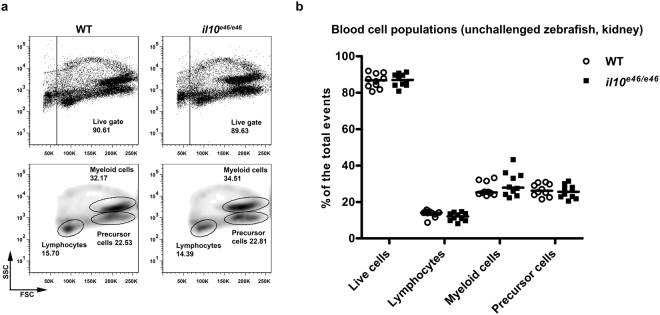
Figure 2.
Unchallenged il10e46/e46 zebrafish have kidney blood cell populations similar to those of WT control fish. (a,b) The relative proportions of live cells, lymphocytes, myeloid cells and precursor cells were determined with flow cytometry in il10e46/e46 mutant zebrafish and in WT fish (n = 10 in both groups) based on granularity (SSC) and cell size (FSC). Representative flow cytometry plots are shown in panel (a). Gated populations are outlined, and the cell counts inside the gates are given as the percentages of the total viable cell population. The median of the relative proportions of different blood cell populations is presented as a scatter plot in panel (b). A two-tailed Mann-Whitney test was used for the statistical comparison of differences between il10e46/e46 zebrafish and WT controls.

