Figure 2.
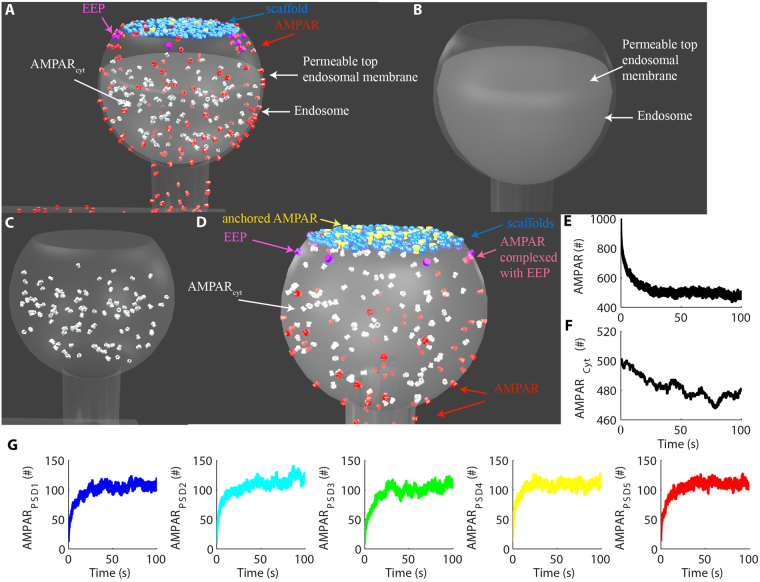
AMPAR trafficking model. (A) To simulate the endocytosis and exocytosis of AMPARs, we implemented a single EZ per spine where we placed 10 EEPs to catalyze the internalization and externalization of AMPARs. (B) We simulated a single large endosome inside each spine head. The top membrane of each endosome was permeable to cytoplasmic AMPARs (AMPARcyt) to allow their interaction with EEP. The impermeable bottom of the endosomes confined the cytoplasmic molecules inside the spine heads. (C) Detailed view of AMPARcyt in the cytoplasm of the spine head. (D) Molecular components of the model and their distributions. In (C,D), the endosomes were rendered transparent for better visualization of the intracellular molecules. (E) Time course of the total amount of free AMPARs. We released 1000 free AMPARs at the beginning of the simulations to verify their accumulations at the synapses. (F) Total number of AMPARcyt obtained by the balance of exocytosis and endocytosis of receptors. (G) Number of AMPARs at each PSD combining free and anchored receptors.

