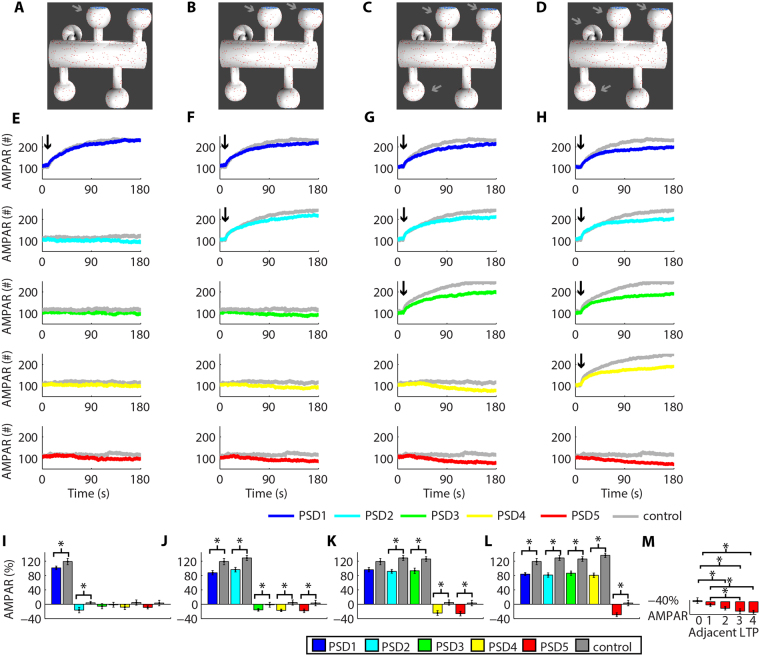
Figure 4.
Activity-driven LTP causes heterosynaptic depression. (A–D) Synapses with induced LTP. (E–H) Time courses of the changes in the number of AMPARs at each PSD simulated during LTP at PSD1 (E), PSD1 and PSD2 (F), PSD1-PSD3 (G), and PSD1-PSD4 (H). The controls correspond to simulations without the induction of synaptic plasticity (Suppl. Fig. S3) and LTP at single synapses (Suppl. Fig. S4). (I–L) Changes of AMPARs at each PSD from t1 = 10 s to the end of the simulations caused by LTP at one (I), two (J), three (K) and four synapses (L). The asterisks indicate statistically significant differences (P < 0.05) for paired T-test comparisons with control simulations. (M) The number of vicinal LTP modulated the amplitude of heterosynaptic depression at PSD5. The asterisks indicate statistically significant Tukey post hoc comparisons (P < 0.05).

